
In Day 11 of the 30 days to master part-time swing trading challenge we use volume to analyze accumulation and distribution patterns in stocks and markets.
Accumulation and Distribution: Keys to Analyzing Volume
Let’s keep this simple by thinking of accumulation as buying, and distribution as selling. A bullish stock shows strong signs that a stock is being accumulated or a high level of demand. Conversely, a bearish stock shows more supply than demand in the form of distribution. The more accumulation we identify, the more buying pressure there is on the stock. The more distribution, the more sell-side pressure. As this pattern gets stronger and continues longer, trends in the direction of the pressure form.
How do we identify accumulation and distribution?
By analyzing volume patterns.
Identifying The Volume Patterns
As we have already noted, positive volume patterns signals accumulation, while a negative volume pattern signals distribution.
The simple way to think about accumulation and distribution volume patterns is to simply eyeball the chart and study the volume bars. Pay close attention to the size of the bars, especially the bars that are outside the average size.
If the big bars are green, and the smaller bars are red, we can decide that sharer is more buying than selling volume. This is accumulation.
On the other hand, if the big bars are red, and the smaller bars are green, there is more selling than buying. This signals distribution.
Keep in mind that we are not focused on one or two individual bars, but overall patterns.
Multiple bars make trends.
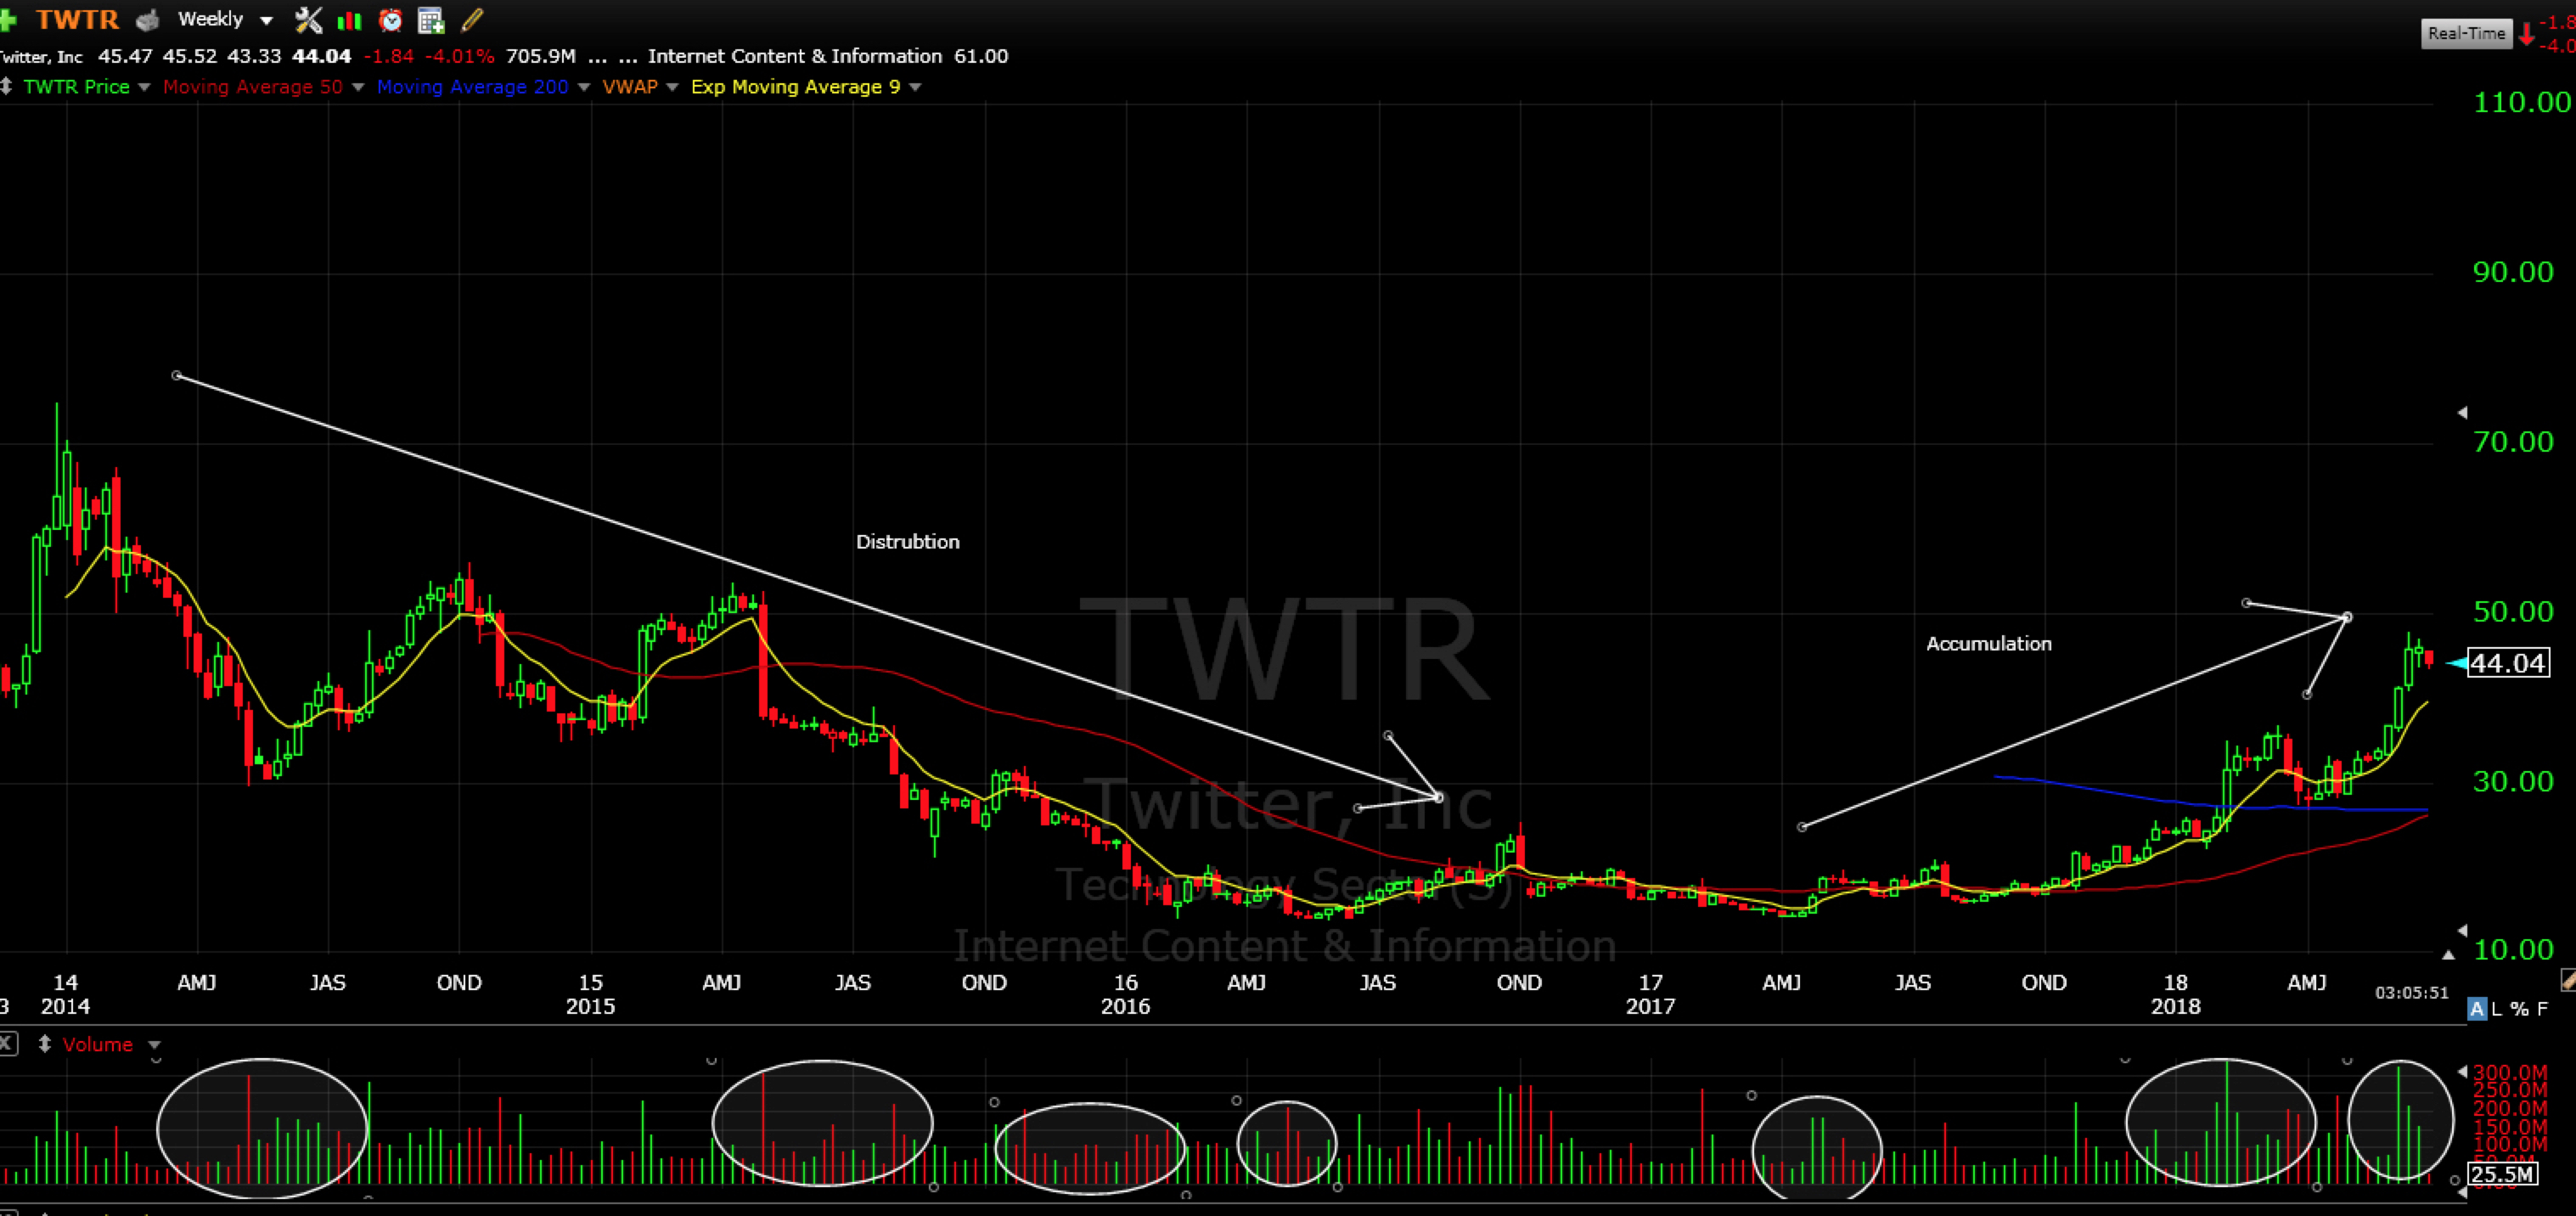
The Distribution and Accumulation of Twitter
Take a look at the Twitter chart. Notice that from 2014 thru 2016 the stock was in a downtrend. However, there were periods where price action alone would indicate a potential bottom or reversal. However, every one of the bounce attempts failed and were actually textbook short opportunities.
Now it’s easy to say this now, but how do could we know during this period that twitter was a sell?
By the volume pattern.
During this two year period, red volume dwarfed green volume. It was not until late 2016 and early to mid-2017 that we started to notice a change in the volume trend. Now big green started to outpace red volume.
This signaled a dramatic shift in the volume trend. Now there was more buy-side pressure than sell-side, which predicted the 2017 and 2018 uptrend.
How to Analyze Volume in Uptrends, downtrends and Rangebound Markets
Now that you know what to look for, keep in mind what type of trend a stock or market is in, and then analyze the volume pattern according to their parameters.
- If stock in uptrend with positive volume pattern (accumulation): expect continuation of uptrend
- If stock in downtrend with negative volume (distribution): expect continuation of downtrend
- If stock in uptrend with negative volume (distribution): Expect reversal at some point
- If stock in downtrend with positive volume (accumulation): Expect reversal at some point
- If stock rangebound or bottoming with new accumulation: Expect breakout at some point
- If stock rangebound or bottoming with new distribution: Expect breakdown at some point
Now that you know what to look for watch today’s video and then do the exercise.
The Day 11 Exercise
- Pick 10 different types of stocks
- Go back 5 years and analyze the volume patterns during each chart’s major uptrends, downtrends and range bound phases.
- Now study the current patterns in these stocks and predict future outcomes.
Previous Posts
Day 1: Getting Started
Day 2: Analyze the Market
Day 3: How to Use Moving Averages
Day 4: Managing Risk and Setting Stops
Day 5: Managing Risk on a Macro Level
Day 6: Managing Risk and Taking PROFITS
Day 7: The Reward to Risk Ratio
Day 8: Stochatic Indicator
Day 9: Case Study Webinar Replay
Day 10: 5 Keys To Trading With Volume
Swing Trade Service
This swing trading service is great for those that work and can’t monitor the computer all day. We have in-depth nightly reports on the gameplan for the day/week and all stock picks that I trade will be alerted and emailed to you.
Check out the Swing Service HERE
Follow me, Paul Singh AKA “TheMarketSpeculator” on Twitter or email me at SinghJD1@aol.com
Important Links
Link to YouTube Live-Stream on June 26th
[rf_contest contest=’10333′]
