My last few posts have been about aligning stocks on multiple timeframes, how to trade intraday breakouts and how to trade flat top breakouts. Well today, we got a perfect example of all of these in one stock ($VHC) and we nailed it.
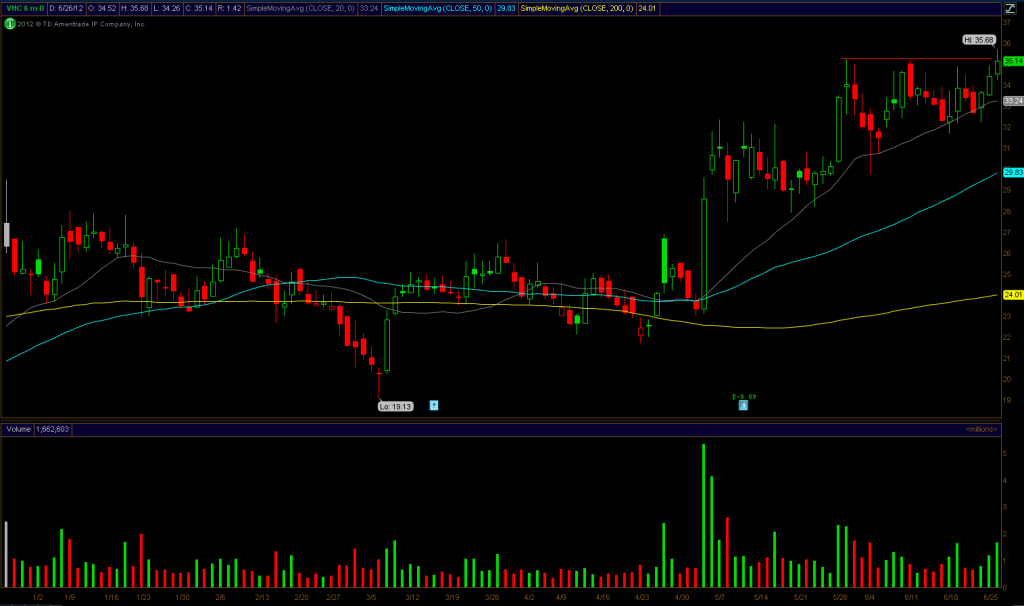
$VHC had been on my radar and on my “top” setup list for the past week. I loved the chart because it had tapped that $35.2 level multiple times and had formed a flat top. I knew it was inevitable that it would breakout.
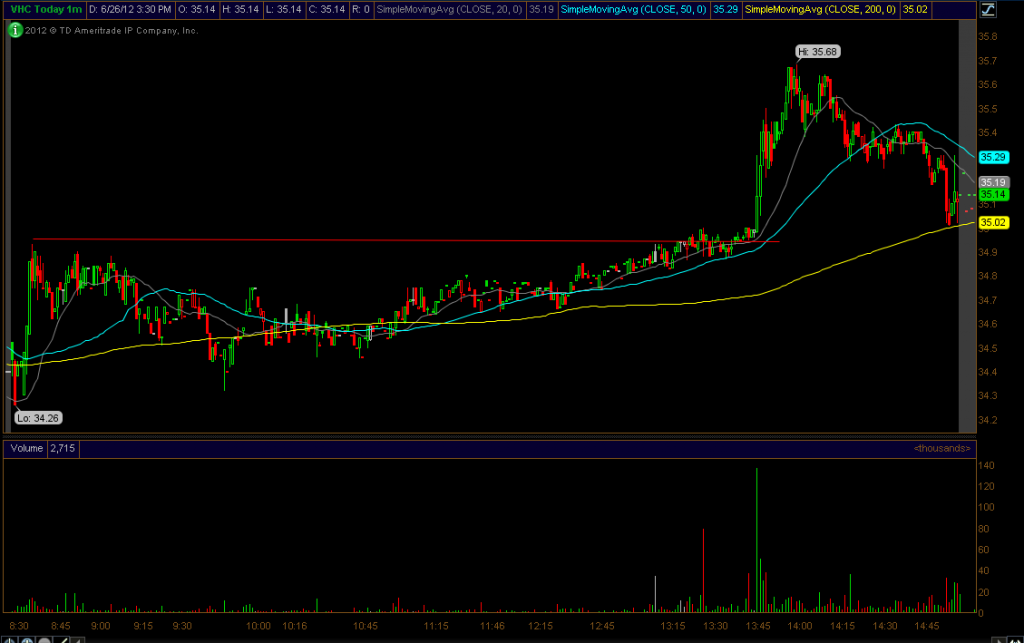
I bought this stock today in the chat room at $34.94, so if you look at the daily chart, that seems a little early right? The new high breakout is $35.2. Well, that’s where aligning stocks on multiple time frames comes in.
If you look at the intraday chart of $VHC, you will see that the stock broke intraday at $34.94, exactly where we bought. Basically, we were anticipating the daily chart breakout by buying the intraday breakout. Then once it broke $35.2 that was actually a double up spot. Pretty hard to post quick trades such as this, but if you learn the pattern and learn how to train your eye to spot them, you can make that decision on your own – to add more at $35.2 for the bust out!!


