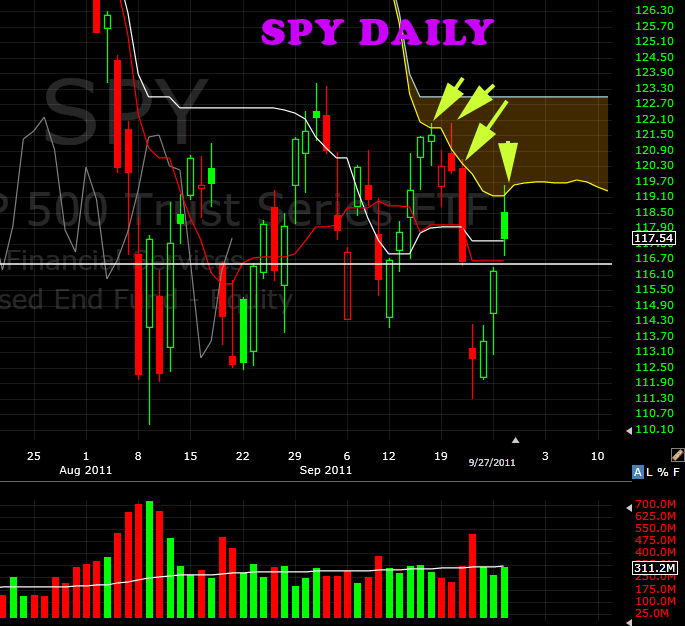
For those of you who follow Ichimoku clouds, SPY is struggling to push through… take a look at the chart below. The basics idea to get out of this is that SPY has tested the cloud (resistance) 4 times this month. If history holds true, the market should reverse down tomorrow. Of course, there is no guarantee, but one thing that’s for sure – it’s hard as hell to swing more than a day or two in a market that gaps up and down all the time (it’s a day trader’s market). Today, we finished up for the third consecutive day on average volume (50 day moving average). I prefer for gap runs to have big volume behind them, so I’m not overly confident here based on volume alone.
Also notice the thickness of the cloud… usually represents more resistance. I like the flat top however.. The flat top of the cloud lines up nicely with the recent highs printed at the turn of the month. THAT is the real breakout zone. That level (around 123.30) would also get us back above SMA50 (not shown below). Right now we’re riding under SMA50 with little proof we’ll shoot above.
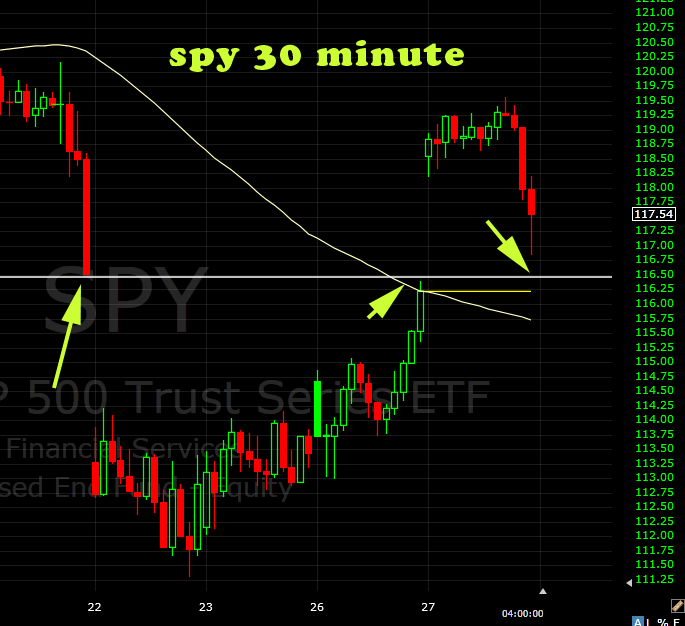
Now to the 30 minute chart…..
Hmm.. Another island of candles with overall trend very hard to spot. There is clear level of moderate support just above the 5 day moving average (yellow line). Based on today’s close, there is a real chance we’ll test horizontal support and SMA support. That’s what I want to watch.. will SPY stay above the 5 day moving average? If it attempts to hold above and then falters by lunch, I’ll likely short the market… not a heavy position, but I’ll toss some coin at it.


