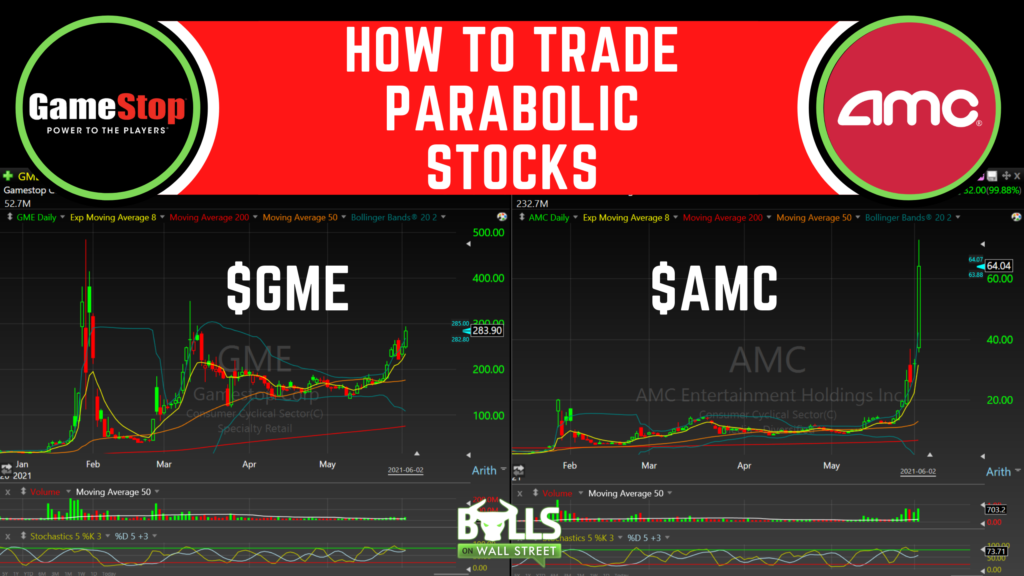
Who isn’t talking about the massive $AMC squeeze? Parabolic stocks like $AMC are life-changing, for better and for worse. Fortunes are made and lost on these names.
This pattern is predictable and happens over and over again in the financial markets.
They offer AMAZING opportunities for traders who understand how to trade them.
They offer the potential to make huge returns in a short period of time. But the same amount of money can be lost can be just as fast. You need the right strategy and good timing.
This blog will show you how to trade them:
What is a Parabolic Stock?
A parabolic stock is a stock that has seen an exponential increase in its stock price. A parabolic move in a stock is defined by a speedup in price appreciation, relative to prior price action. Let’s look at a stock trading at $50 a share as an example over 7 days:
Day 1: $50
Day 2: $51
Day 3: $53
Day 4: $58
Day 5: $68
Day 6: $98
Day 7: $62
This would be defined as a parabolic move because we have a speedup in price increase relative to prior price action. A parabolic move is a short-term fluctuation in price.
Parabolic moves will often be followed by a sharp decline in price value. As the price action speeds up, longs become more likely to take profits and short-sellers become more likely to enter the market because both know a sharp decrease in price action is coming.
Why Do These Moves Happen? $GME Example
When you see parabolic stocks, a key concept to understand is a stock’s float.
The float is number of shares of a stock that are available to trade on the open market. These shares can be owned by anyone. It is an important fundamental characteristic to understand about a stock before investing in it. A stock’s float will often influence a stock’s range.
Why pay attention to a stock’s float?
A stock’s float is essentially telling you how much supply of a stock is available on the open market. Stocks with a low float, also referred to as low float stocks, tend to be the most explosive stocks. This means they are the stocks that have a high probability of making a big move in a short period of time. The move $GME made recently is a perfect example of how explosive these low float stocks can be:
So what’s float rotation have to do with this?
Supply and demand. Let’s look at the legendary $GME short squeeze that just happened:

The reason this happened is that it had a ton of short-sellers in the stock, and a low float. A stock with a low float takes less buying pressure to send upwards. There is a low supply of sellers because of the low float. Once it gets momentum and volume coming in, it doesn’t take much buying power to send it into orbit.
Look at the volume $GME was trading on those days. Its float is only around 50 million shares. It was trading 2x-4x that amount on a daily basis. This means the float rotated. Every single share available in the public market traded that day.
How to Trade Them
It is useful to understand a parabolic move from the perspective of longs and short sellers. A long will recognize when a parabolic move is taking place is to know when to enter, and when to start taking profits on their position. You also want to recognize this pattern as a time to NOT put on a long position. A short seller will want to recognize this pattern as a potential shorting opportunity. Here are the 4 parts of a parabolic move:
The Slow Advance
This is the easiest part of this is cycle is this part. The stock is in a strong uptrend. There will usually be a lot of bearish sentiment because a junk company is making a big run-up. Short-sellers get trapped as it pulls back, gets bought up, and then grinds higher.
The Blow Off Top
This is when peak “FOMO” kicks in. All the retail traders who thought it was too high to buy in, getting tired of missing out. They start chasing, and early shorts start to get liquidated by their broker. This is when the smart money begins to start selling out of their position. We are seeing this right now with $AMC:

The Crash
Finally, the top is in as the supply exceeds demand. This is where short-sellers can get their payday. Parabolic stocks take the stairs up, and the elevator down. $GME dropped almost 80% in a single day once the top was in. As a short-seller, this is a setup you would rather be too late than too early on. This is not a trade for beginners to try with large size.
The Deadcat Bounce
After the stock has peaked, at some point the stock will have a massive rally. NOT back to highs, but a temporary move. You can see how $GME bounced almost 200%, from around $100 to $300 after its crash. These are difficult trades. Like on the front side if you are trying to short the top, you would rather be a little too late than too early.
After the dead cat bounce happens, usually the stock will begin to slowly fade off back to where it came. After the dead cat bounce it has no interest to us, momentum traders, since the fade is slow and usually takes weeks and months.
Parabolic Stock of the Present: $AMC
So what will happen to $AMC next?
We have no idea. It’s easy in hindsight when you see a parabolic move to say where you should’ve bought and sold. But look at $AMC right now: Does anyone know where the top is? Does anyone know when it will crash?
One thing we do know for certain: Eventually it will follow these exact cycles. It will eventually have a big crash. And then have a dead-cat bounce. The take-away: Manage your risk aggressively by trading these names. They can end your trading career in a few hours if you got stuck on the wrong side of the trend.
Summary

Live Trading Classes From Experienced Traders: Join Our Live Trading Boot Camp
Space fills up fast in our boot camps. Apply for your seat to see if you qualify!
