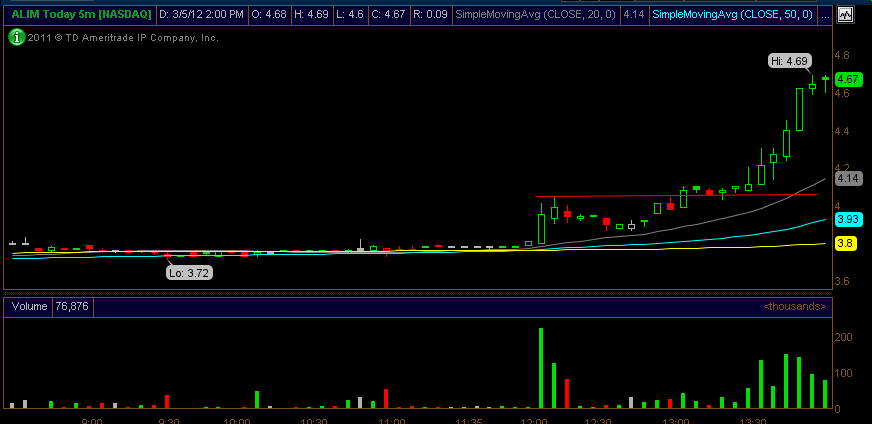
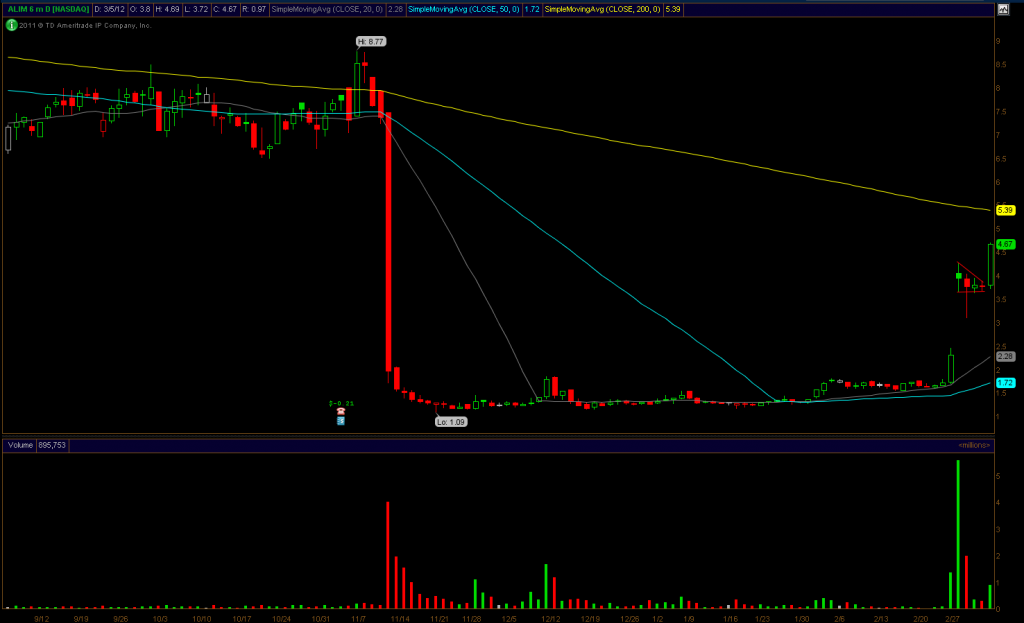
Today we alerted ALIM in the chatroom for a quick 40 cent pop. The reason the alim breakout was so powerful was because it was breaking on multiple timeframes. Here are the mechanices behind how to take trades on multiple timeframes. You use the daily chart to find your setups and you use the intraday chart to time your entries. Once they align and breakout at the same spot on two charts.. thats when you get the boom boom.
ALIM- intraday break at 4.10 is where you look to get in this chart. Once you see that area holding on the pullback you have found a winner.
The reason that this was a powerful breakout was because if you take a look at the daily chart.. the stock was also breaking out of a flag!!
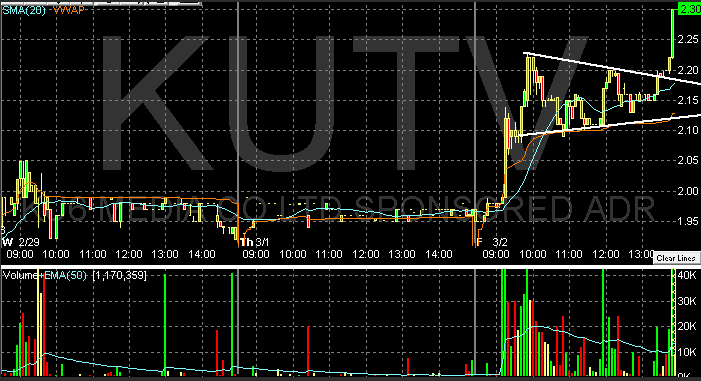
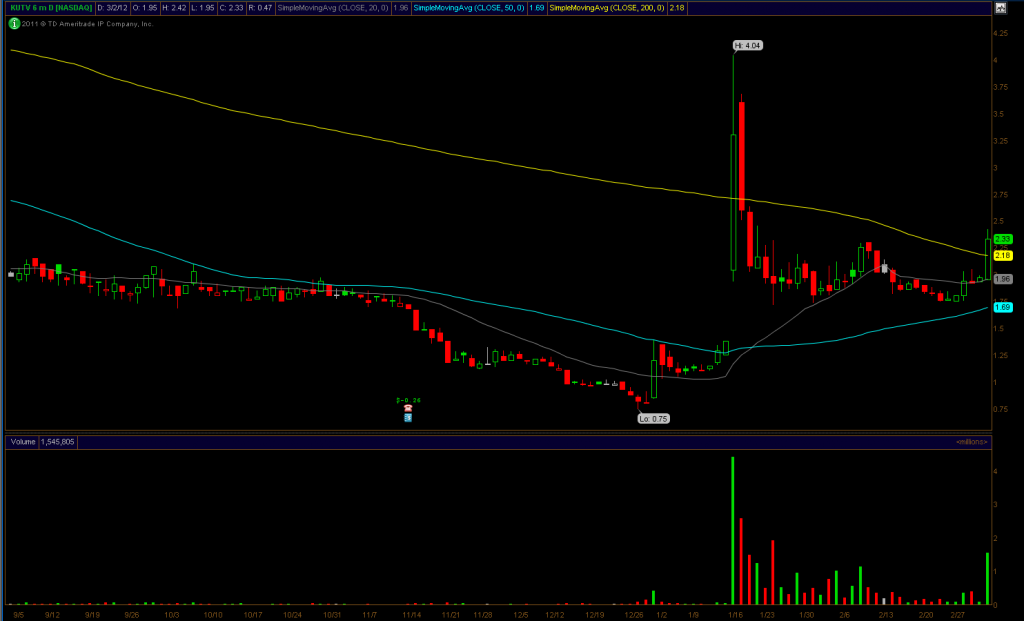
KUTV is another example of a recent chart that brokeout on multiple timeframes. Stock is super strong in the morning then sets up intraday by flagging. Later in the day the stock breaks the flag and breaks out at 2.20. If you look at the daily chart.. you will see that 2.20 was aslo the breakout of the 200dma. So together they presented a powerful breakout spot at 2.20 area.


