Quick Summary
SPY’s bearish evening doji star continues it’s textbook short setup. Also a trend within trend long bounce trade setup. Entered GDP and UA long today, along with short term SPY long bounce trade. Still holding half of SPY short. Many stocks pulling back close to entry points. Some leaders showing strong short term bearish corrective setups. Added EMES (short), ATI (short) and IBN (long) to Focus list. Market leader GMCR filling gap, while CAT and TSLA look short term bearish. All tradeable setups at entry levels. Trader education discusses trading on different time frames, as I did with SPY today.
The Market
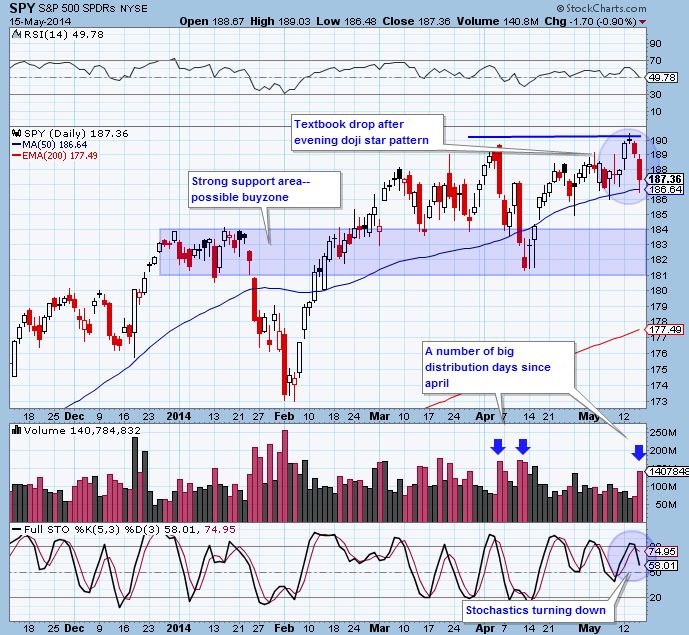
Key Pivot Levels: 190.42: new high resistance 186.64: 50 day moving average 181.31: recent low 181-184: plenty of buying in this range.
Under the Hood:
Textbook. That is what today was. The bearish evening doji star pattern could not have worked any better. Today’s price bar dropped right down to the 50 day moving average before bouncing a bit. This is what we were watching for our first target for the SPY short, and it hit in one day (side note: I traded the bounce long in a separate trade-see “trades” section below). Where do we go from here? It’s tough to say with moving average support sitting under the price bar.
Notice the amount of distribution days since April. We have had a number of big down bar price and volume days, with no similar up days. This does not bode well for a resumption of the uptrend. My guess is that the moving average will break after a minor bounce. There is significant support in the $181-184 range.
Note that stochastics have rolled over. For swing trades, I do not want to go long until at least 20 is hit.
Bearish Evening Doji Star pattern

We don’t know if this is what will print. However, it pays to anticipate.
T2108 and A/D line are neutral.
Trading Game Plan:
Today was a good spot to take some profit (explained further in Trades section). Those who missed the short trade and want to get short now, this is a tough entry level. The risk ratio is not good at this level. A bounce would allow for a short entry, but if you place your stop above the high at $190, it will be too high for a good risk ratio. You will have to place your stop above the candle for that day and hope a bigger bounce doesn’t occur.
Traders who can manage positions on a very short time frame, can play a bounce long while holding the existing short position. I know it’s counter-intuitive to hold a position both long and short. You have to think of them as two different positions on *different time frames*.
The pullback has some watchlist stocks at or near buy areas. These can be played with caution, managing risk closely. Expect a decent probability that you will be stopped out if the market continues to slide. Keep losses small. Many prefer not trading or entering when there is this type of uncertainty. I don’t agree. A good trader knows how to manage positions, hedge and keep losses small. It’s a skill that’s equal parts art and science.
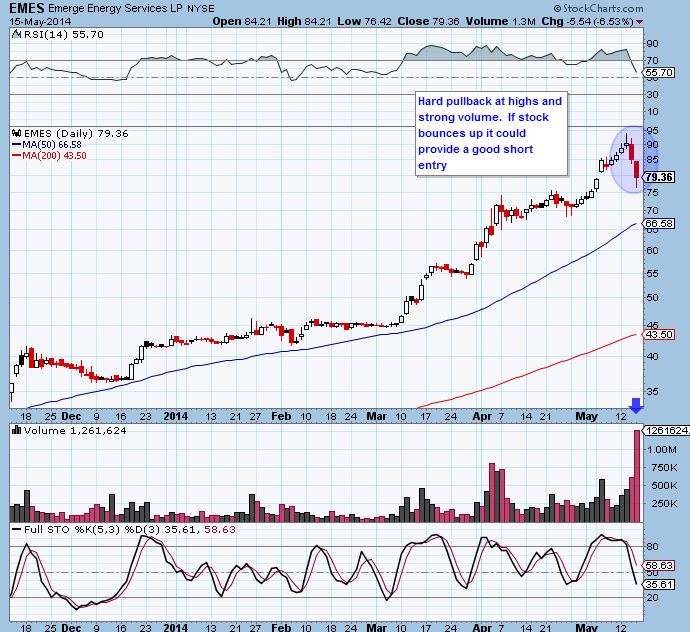
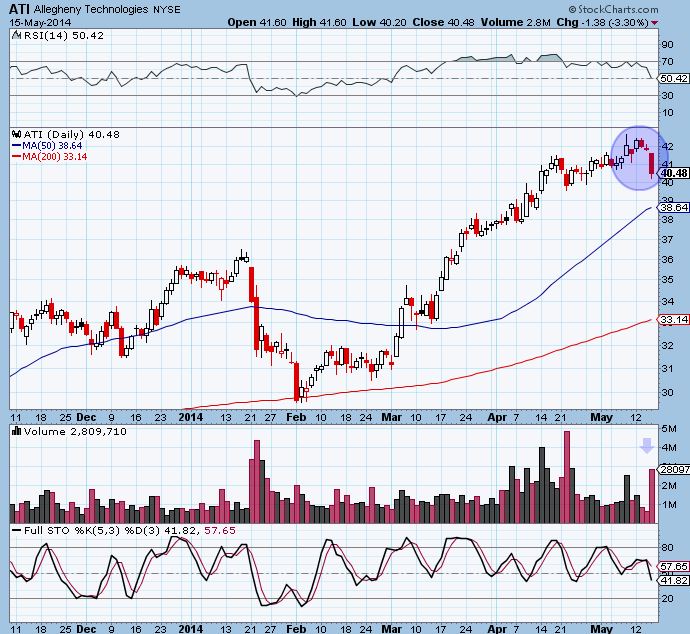
The other type of pullback is the more “corrective” deeper pullback. These can be played as shorts on a bounce. See EMES and ATI in Focus List.
The Focus List
Here we find actionable setups culled from “the watchlist” for the coming trading day.
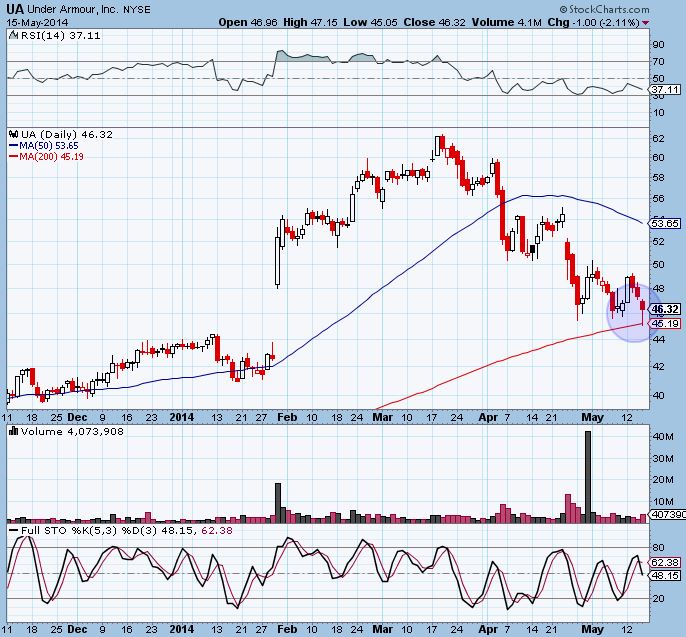
UA dropped right into our buy zone (mine hit at the limit order price mentioned yesterday $45.50) and bounced beautifully, printing a hammer candle. This candle is perfect for bounces off support. Entry can still be made if there is a slight pullback tomorrow. My stop is around $44.50. The target at $48.50 near recent high gives 3:1 risk. There is potential for a bounce to the 50 day ma at 52. Ideally I would take some off the table at $48.50, move my stop up to entry, and let the rest ride.
GDP bounced exactly off the support line we talked about yesterday. If looking to enter, a slight bounce still provides entry. I entered today near the support line (posted on twitter)

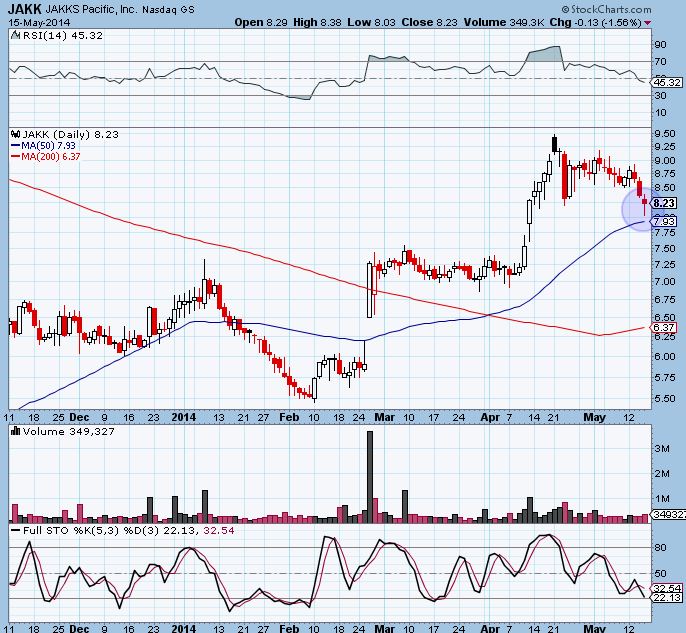
JAKK broke the level of support I had talked about and moved down to the next, strongest level, the 50 day ma. I was stopped out of my position for a small loss. I thought about re-entry as it neared the 50 day ma, but decided against it. It’s a good trade, I just don’t want too many long positions in this market.
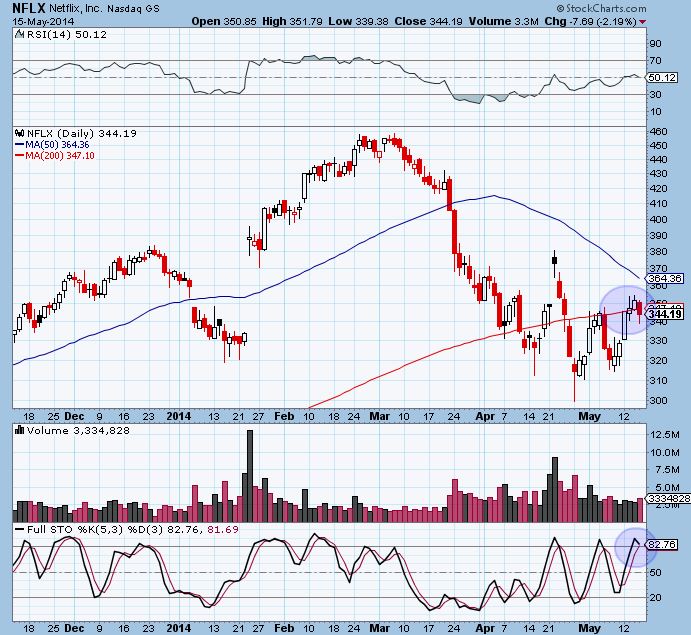
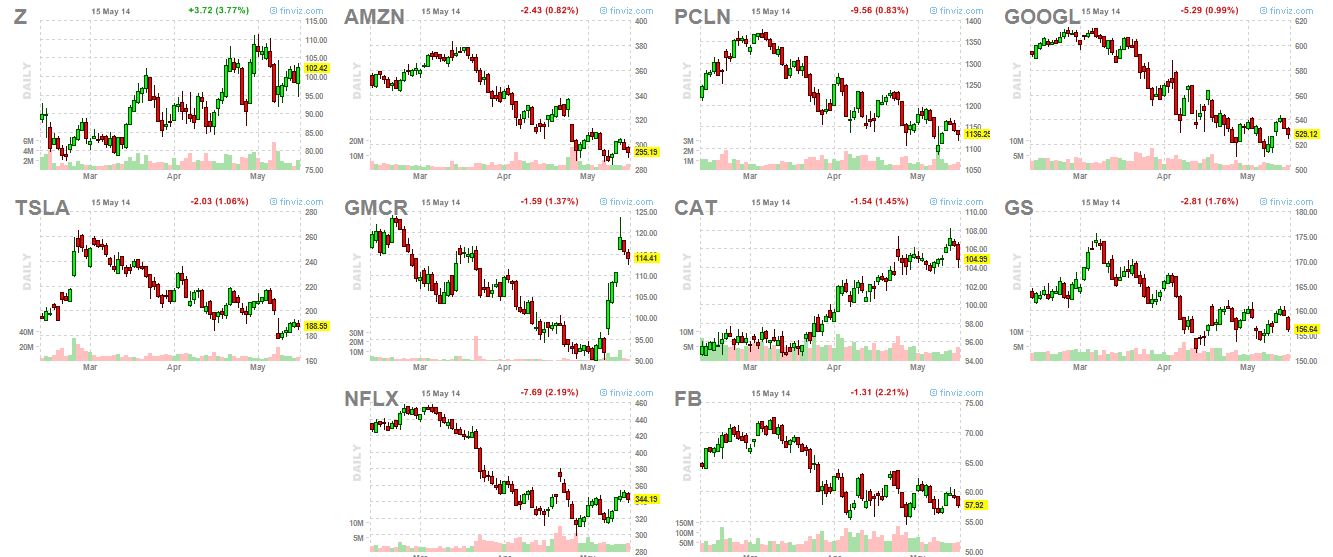
NFLX started a pullback at resistance, breaking back below the 200 day ma. We still need a lot more pullback to enter. I was asked why I am not shorting on a smaller time frame with NFLX if I expect a pullack, then reverse when my buy zone is hit. The reason is the positive volume. I don’t like to short against that type of volume. I’ll use it to my advantage in a long entry at a better price.
New Focus list additions from watchlist:
EMES has been a strong trend stock that pulled back hard with big bars on high volume. This type of pullback signals a deeper correction. I’d like to enter on a weak volume bounce that takes a few days. A pullback to the 50 day ma is in play.
ATI has almost identical setup
DXM, YZC, IBN, PDS and AAN all are pullback setups near good buy points. I don’t like the focus list to get too big, so I’ll pick the best one to chart:
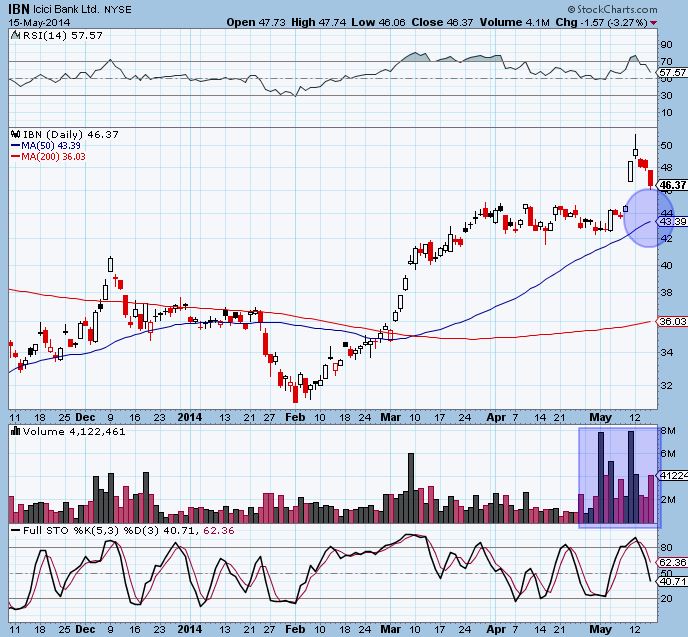
IBN is in the hot India sector. Much like market leader GMCR below, it is filling a bullish gap and has a great volume pattern. That is also where the 50 day ma converges, making for even stronger support. Think about why gap fills are great entries . . .it’s all about trader psychology. Those that missed on the big breakout have a chance to enter. So do we. I’d like to enter as close to $44 as possible. The target would be near $50 and stop under the 50 day ma. This gives us a whopping 6:1 risk ratio.
The Watchlist
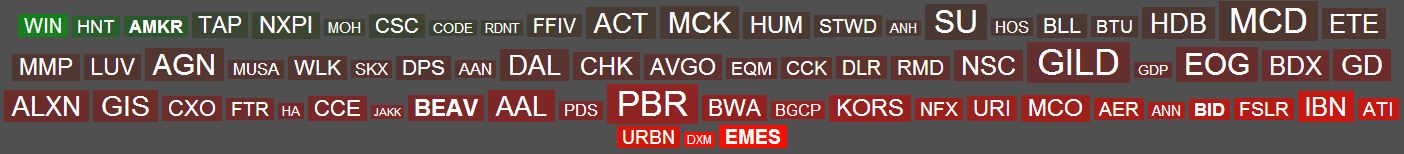
Lots of red. Aside from WIN, the few stocks that were green did not breakout or do anything significant. There is lots of significance in the red as pullback trades.
Market Leaders
GMCR pulled back as we watch for it to fill the bullish gap around $110. CAT printed an ugly candle as it pulls back from its highs. This type of candle near a top can signal a short term trend change when near highs. I might look to short if it bounces a little, with a stop above recent highs. TSLA is forming a bear flag pattern as it fills a bearish gap (reverse of GMCR)
Sector and International ETFs
This list of “watchlist” ETFs is used a number of ways. Most are market leading ETFs that I use to find watchlist stocks using a “top down” approach. You’ll notice in my watchlist that a number of stocks come from healthcare. materials and energy, sectors that are represented here. I also trade ETFs that have good setups. Finally, following sector ETFs can give you an idea of where money is flowing and an overall gauge of the market. I carefully watch the 5 and 30 day price trends versus the market. This gives me an idea of where money was and is flowing.
No real changes or significance. No need to even print the chart.
Current Trades
Exited half SPY short position and letting rest ride. Also played bounce in SPY by going long on a shorter time frame. Stopped out of JAKK for a small loss. Entered long UA and GDP.
Trader Education
Trades can be made on different time frames. You may be looking at a longer term uptrend, and within it is an intermediate overbought condition with a bearish candle pattern, and within that a very short term long bounce entry, all within one stock or index. That is exactly what happened today.
SPY is still in a long term uptrend. The pattern of higher highs and higher lows has not broke. A “position” trade playing the trend here must be long. Meanwhile, the shorter term “swing” trade (holding time anywhere from 1 day to a few weeks) was to short, with the bearish evening doji pattern. In this time frame, that trade still exists. On an even shorter time frame (day trade to 1 or 2 days) there is an obvious bounce setup off the moving average. We can keep going down to scalpers who are trading within minutes.
So today, while I am still short on my SPY swing trade, I saw an opportunity to play a bounce long on a shorter time frame once the 50 day ma was hit. I treated this as a completely separate trade. You may ask why I didn’t exit my swing short trade if I expected a bounce. You can’t do that on swing trades. You will lose out on a lot of trades. You don’t want to micromange a trade, screw up your risk and miss out on the real move. If you want to play something within your swing trade, just create a separate trade on a different time frame. Think of it as if you are trading two entirely different stocks.
Enjoy this post? Over the next two weeks we will be rolling out a new swing trading service with Paul Singh. To learn more, emal info@bullsonwallstreet.com !
