Quick Summary
The expected bearish evening doji star printed today. Expecting pullback to at least 50 day ma. UA added to the Focus List, and watching IBB from ETF List. India and Brazil remain strong. Over coming days watching market leader GMCR to see if it will fill the gap. The evening doji star setup is quite reliable, offering a 70 percent success rate
The Market
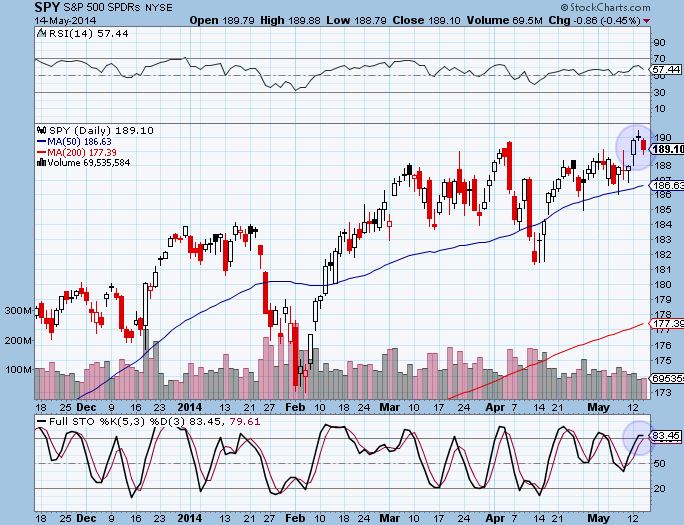
Key Pivot Levels: 190.42: new high resistance 186.63: 50 day moving average 181.31: recent low 181-184: plenty of buying in this range.
Under the Hood:
That evening doji star we were eagerly awaiting played out perfectly. This is a textbook setup, especially with an overbought stochastic. For those who were looking to enter short, the morning gave you that opportunity as the gap down was mild, before giving way to a bigger drop later in the day. If the typical evening doji star plays out, a pullback to at least the 50 day moving average is expected. The fact that stochastics are overbought and look ready to roll over is a good sign for those looking at a pullback.
Bearish Evening Doji Star pattern

We don’t know if this is what will print. However, it pays to anticipate.
T2108 and A/D line are neutral.
Trading Game Plan:
Short entry here is tough if your target is the 50 day ma, though a pullback up to $189.50 would allow for it. At $189, if you place your stop at $191 and target at $187 you are only getting a 1:1 risk ratio. Even with a strong pattern like evening doji star, I generally won’t take this trade because it requires a high win rate. If the target is the low at $182, the April low, then $189 is fine. With 4:1 risk, you can have a very low win rate and still come out way ahead over time.
For individual stocks and ETFs, the expected pullback should provide for some good long entries.
The Focus List
Here we find actionable setups culled from “the watchlist” for the coming trading day.
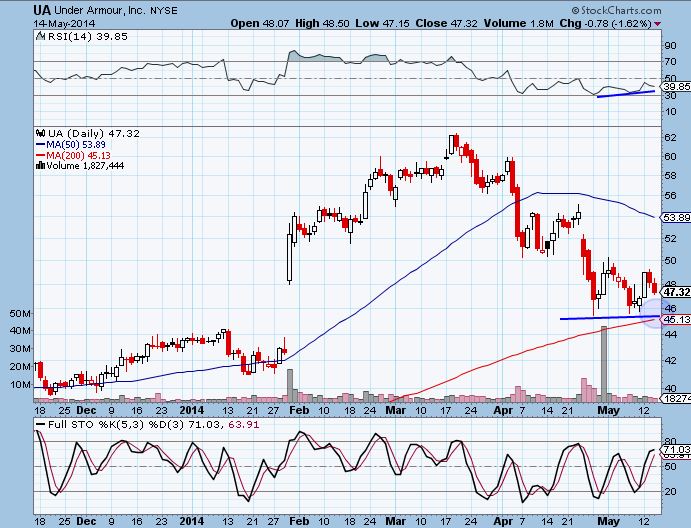
New focus list addtion: UA
UA was a strong momentum play that got hit hard and has pulled back toward the bottom of a huge gap set back in late January. A sort of dirty W pattern has formed near the 200 day moving average, and RSI is strong. This is a stock I will watch closely on pullback. I’d like to enter closer to the 200 day ma. An entry at $46, with a target at the gap down at $52 and stop under the moving average at $44.50 offers close to 5:1 risk. It does not get much better than that.
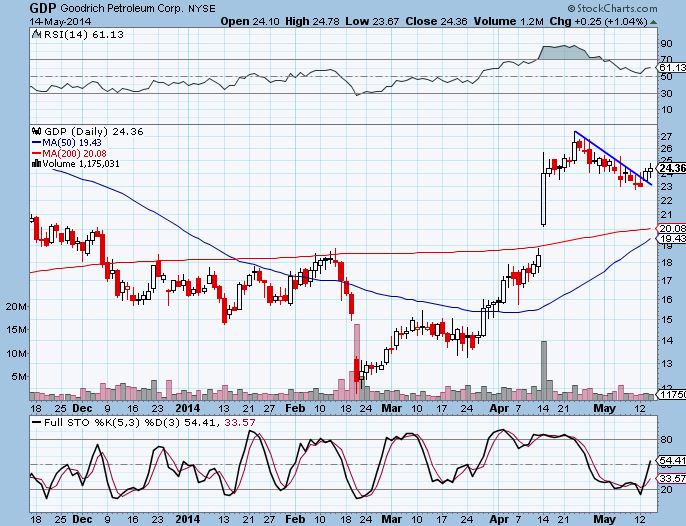
GDP did not pullback with the market at the close. It did momentarily gap down with the market and reached into our buy zone. However, I got greedy with my existing limit order, which was set at the low end of the buy zone at $23.50. If anybody got in under $24, tweet me or add a comment.
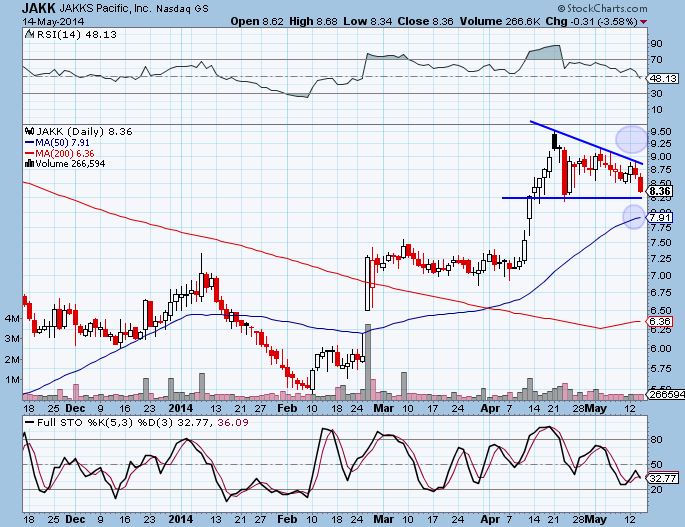
JAKK pulled back below the first line of support and is now near the April low. An entry here offers great risk, although with an expected market pullback this support level might get taken out as well. The next support level is the 50 day moving average, which would be an ideal entry level. I took a small position today because the risk level here is too good, even with the increased probability of a larger pullback. As I said yesterday, SMALL LOSSES ARE GREAT! Embrace them. We want small losses and big gains (at least 2:1, or 2R)
NFLX did not start to pullback. It’s still one to watch. Check yesterday’s report for the setup and entry.
The Watchlist
Most of the energy stocks on the watchlist did well. No gainers broke out or hit levels required to place on the focus list. Most in the red just started pullbacks that re worth watching closely and did not violate support.
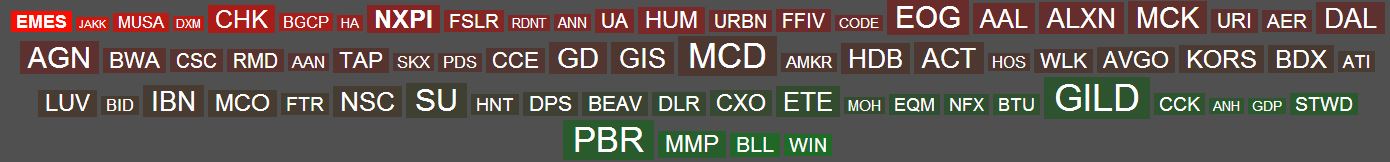
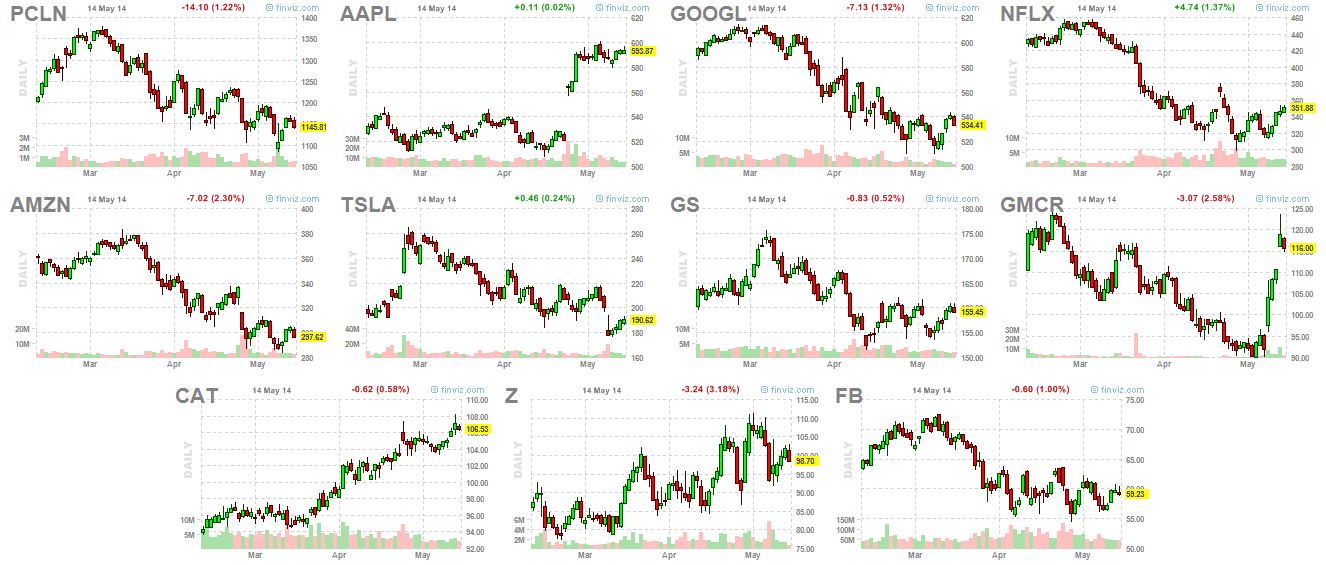
Market Leaders
These are stocks that I always watch, though they might not be in my tradeable watchlist, nor are they actually always leading the market (TSLA and NFLX certainly haven’t in recent months). Nothing significant going on wit these guys. I would like to see GMCR fill the gap. Today’s action and the SPY action could make that happen. The filled gap would be a nice place to enter long.
Sector and International ETFs
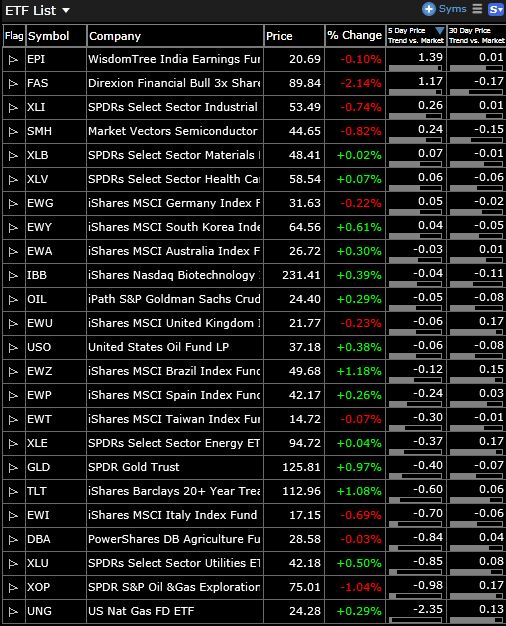
This list of “watchlist” ETFs is used a number of ways. Most are market leading ETFs that I use to find watchlist stocks using a “top down” approach. You’ll notice in my watchlist that a number of stocks come from healthcare. materials and energy, sectors that are represented here. I also trade ETFs that have good setups. Finally, following sector ETFs can give you an idea of where money is flowing and an overall gauge of the market. I carefully watch the 5 and 30 day price trends versus the market. This gives me an idea of where money was and is flowing.
India and Brazil are still strong and Energy and Materials held up well. See IBB below.
 o
o
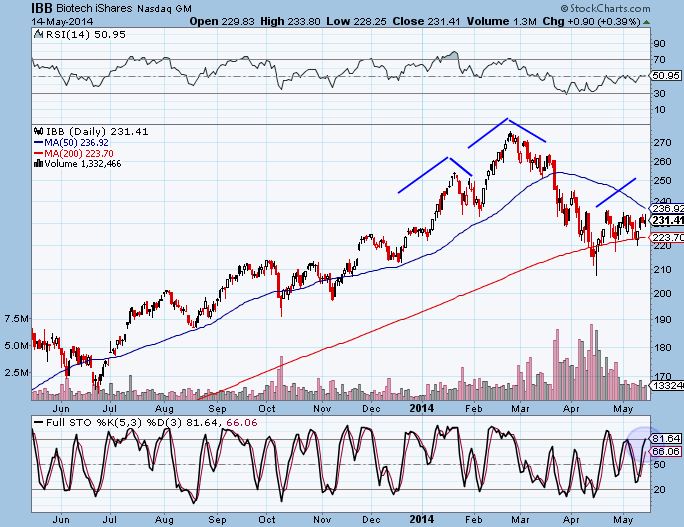
IBB has an obvious H & S topping formation that everybody is watching. Stochastics are also in oversold territory. The 50 day moving average looms, is one short entry. If that breaks, $250 is up near the first shoulder high, which would provide another great short entry.
Current Trades
As noted above, I entered JAKK (though I wouldn’t be surprised to get stopped out and re-enter at 50 day ma). However, I am short SPY near and long UA.
Trader Education
A few readers asked me how reliable the evening doji star pattern is. While there is no pattern that offers 100 percent reliability, it does put the odds in your favor. Bulkowski gives the pattern a 71 percent success rate, which is excellent. The success rate of trades I have actually taken (which might not be accurate for the market or stocks as a whole) going back to 2005 is 74 percent. Note that most of my trades have other parameters included with the pattern. Usually there is a volume pattern showing distribution, stochastics that are at or near overbought readings and the occasional RSI divergence. Nothing is traded in a vacuum. I also like the fact that this setup offers a clearly defined stop level (above the doji). This makes it easy to define risk.
Enjoy this post? Over the next two weeks we will be rolling out a new swing trading service with Paul Singh. To learn more, emal info@bullsonwallstreet.com !
