The last 12 months in the stock market have been INSANE. We have seen one of the strongest rallies in the DOW and S&P ever, IPO’s running on a weekly basis, the marijuana stock bubble, and a ton of other crazy moves in tech stocks.
Here are 5 of the most unique stock charts, and some stand out market movers from the past 12 months (I didn’t include any penny stocks!!). Study them closely, because these patterns WILL repeat themselves:
$TLRY: Tilray Parabolic Summer 2018
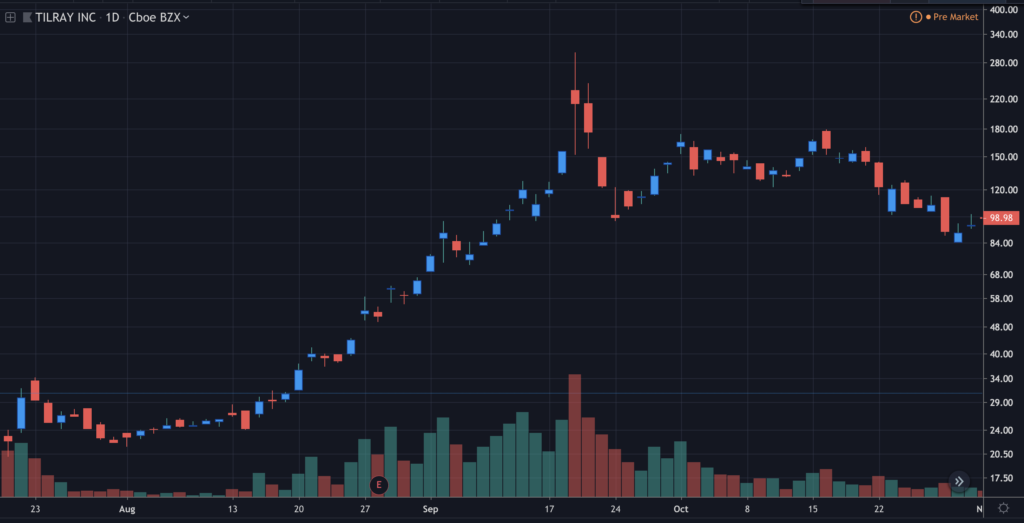
Tilray is an IPO from last summer that ran from about $20 to $300 per share in about a month and a half. Every pothead and their mom owned this stock last summer. This was during the period right after Marijuana distribution usage was legalized in Canada, and many Cannabis-related companies like Tilray had some monster run ups.
But TLRY was the biggest of them all. It went from about $20 a share to a high of $300 in just two months. And then it gave it all back! Now it’s trading under$50 per share, and its bag holders galore.
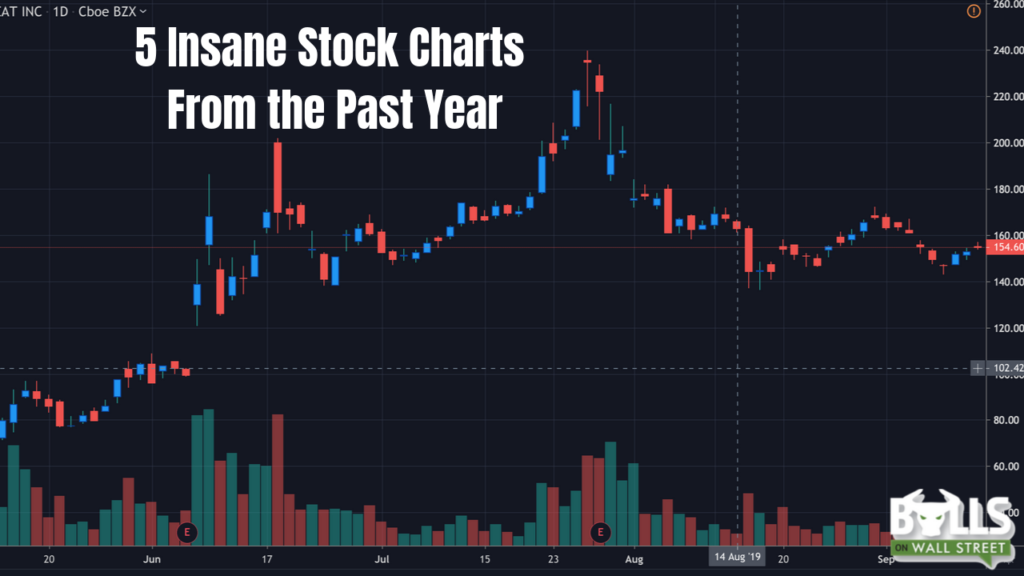
$BYND: Beyond Meat IPO Run Up 2019
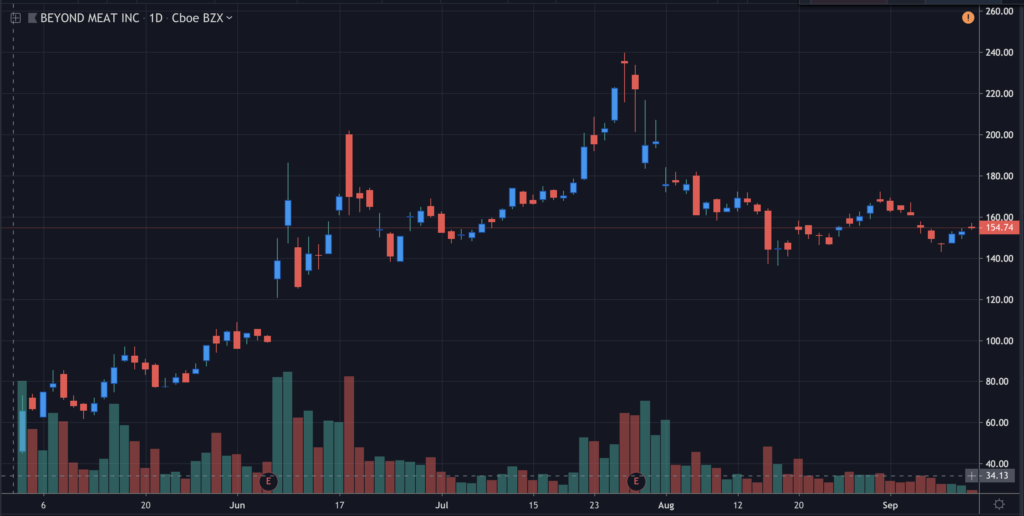
Beyond Meat is essentially a company that makes “supposedly” plant-based meat. It IPOed earlier this year and was a very similar play to Tilray. It just slowly grinded up ever since it’s IPO. Funny thing is that it’s still hanging around today at about $150 a share, still up more than 200% from it’s IPO price!
$ROKU: Post-Earnings Run Up Summer 2019
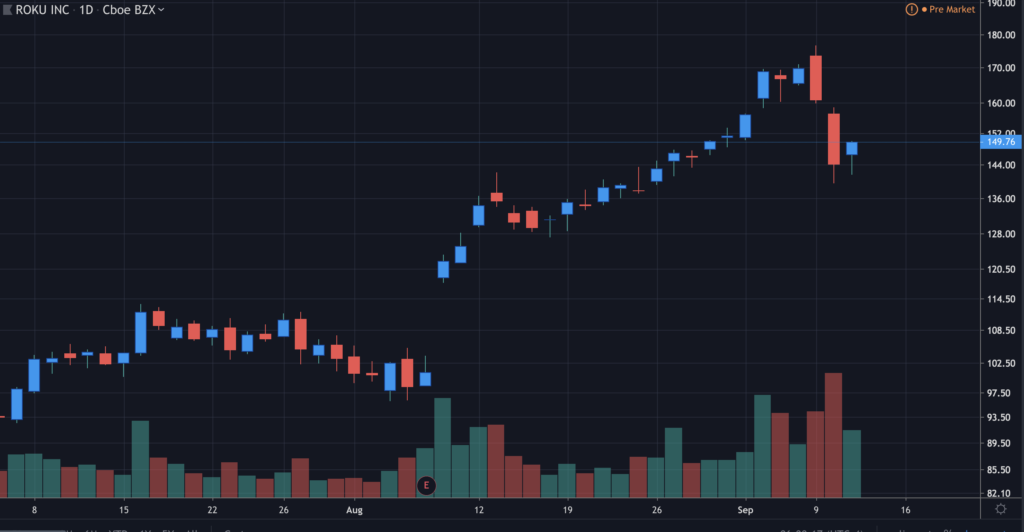
ROKU had earnings a few weeks ago, has been on an insane run the past several weeks. The day before it’s last earnings report it closed at about $100 a share. About a month later, it hit a high of about $180 a share! Overbought can more overbought, and oversold can get oversold.
$SHOP: Shopify 2019 Monster Uptrend
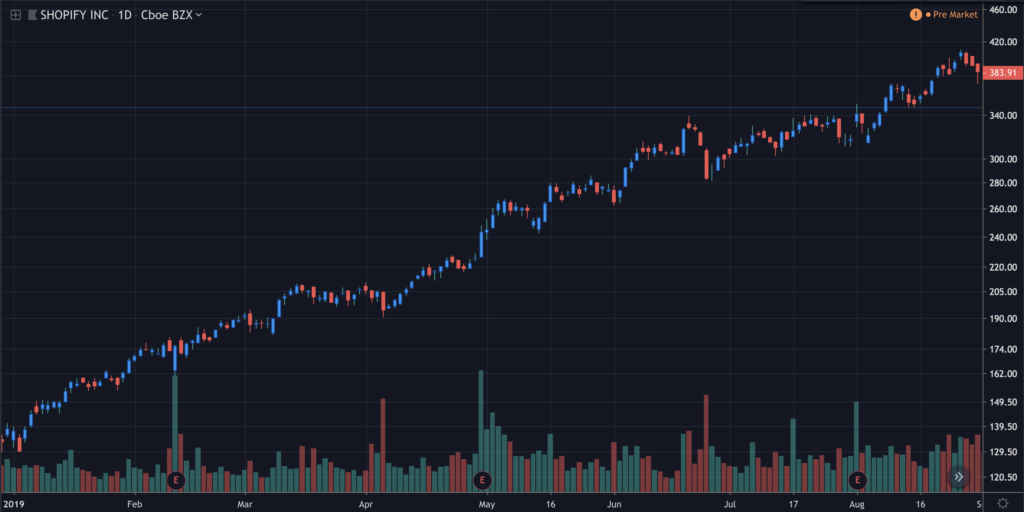
Shopify has been a MONSTER this year. Started the year at about $130 a share, and last week it almost hit $400. Funny ROKU and SHOP have been public Citron Research short calls! Goes to show you what happens when the consensus takes a position, and then things start to go south!
$SPY: Insane Recovery From 2018 Crash
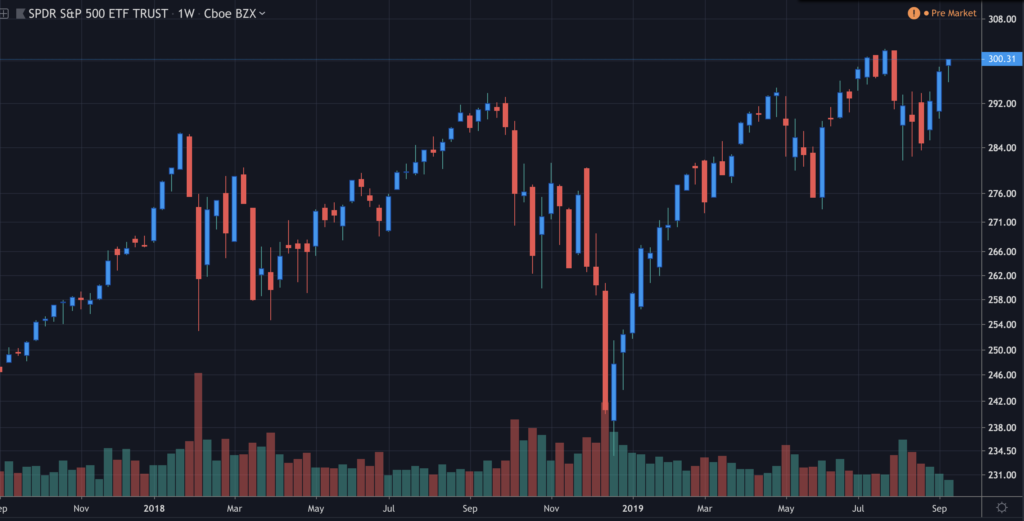
SPY hit a low of around $230 in December 2018. In just 5 months, it came all the way back to make a new all-time high. Funny how this year was predicted in January to be the worst year in the stock market in the past decade. And it actually ended up being one of the strongest years ever!
Biggest Lessons
-Do the opposite of consensus, mainstream predictions
– Timing when short selling is EVERYTHING
-Markets can stay irrational longer than you can stay solvent
– Stocks take the stairs up, and the elevator down.
-Sell into strength, before the crowd panics
Live Trading Bootcamp Starts Soon!
Our live trading bootcamp is designed to teach traders how to overcome their weaknesses and mistakes, and become successful, independent traders. Our next live bootcamp starts on December 2nd, and spots are filling up fast!