Breakouts and breakdowns are my favorite trading scenario. A breakout is when price moves beyond an area of resistance. A breakdown is the inverse, when price moves below an area of support, making it a great short selling opportunity.Whether you are trading on a weekly, daily, or intraday time frame, the concepts and strategies are the exact same. There are many traits that must accompany a breakout for it to be a true breakout. In this article you will learn about all of things needed for the best breakout and breakdown plays.
Traits of Breakouts
Every breakout or potential breakout has a few traits in common:
- No Nearby Resistance: By definition there must be resistance for the stock to break in order to have a breakout. The more substantial the resistance, and the more tests of a key resistance level, the more explosive the breakout is once it breaks the level.
- Volume. Though the volume can be, and often is, low proceeding the breakout, once the resistance level is broken, volume usually increases considerably on the actual breakout.
- A stock that has a history of breaking out and following through. Some stocks, especially stocks down trending on their daily charts, will have difficulty following through. Breakouts on weak stocks that will often get sold into. Make sure you study the daily chart of the past couple years of a breakout play you are looking at. If it doesn’t have a history of clean follow through after breaking out, it will not be of interest to trade.
Gapping over Resistance Levels
Stocks will often have news come out in the pre-market or after-hours trading that causes their shares to increase in value before the market open. This is called a “gap up”. Stocks will often gap up in pre market over key resistance levels. This is another type of breakout we love to play. When the market opens and the stock is trading above all nearby resistance levels, there is a very high probability the stock will continue to go up. INTC is great example of a stock that did this earlier this year:
You can see how it had a big move on strong volume after it gapped up above the $48 resistance level, which was tested twice prior to breakout. Notice the strong volume it had also that day, indicating that further follow through might be coming.
Flag Breakouts
This type of breakout is something I trade almost every day. This setup consists of two important components: the “pole” and the “flag”. The pole is significant increase in price on higher than average volume. After this upword price movement, the stock needs to consolidate. Just like a sprinter needs to rest after running 200 meters, stocks need to pullback and consolidate before making their next move. There are two important things to consider when a stock is pulling back after a move up to determine if it is building a flag pattern or is signaling the end of the preceding upward price movement:
- Volume: The ideal pullback should be on significantly lower volume than that of the run-up period.
- Depth of retracement: The best pullbacks are orderly, and hold up in the upper part of the range of the recent move. If the pullback erases the entirety of the “pole”, you are most likely looking at a reversal rather than a true flag.
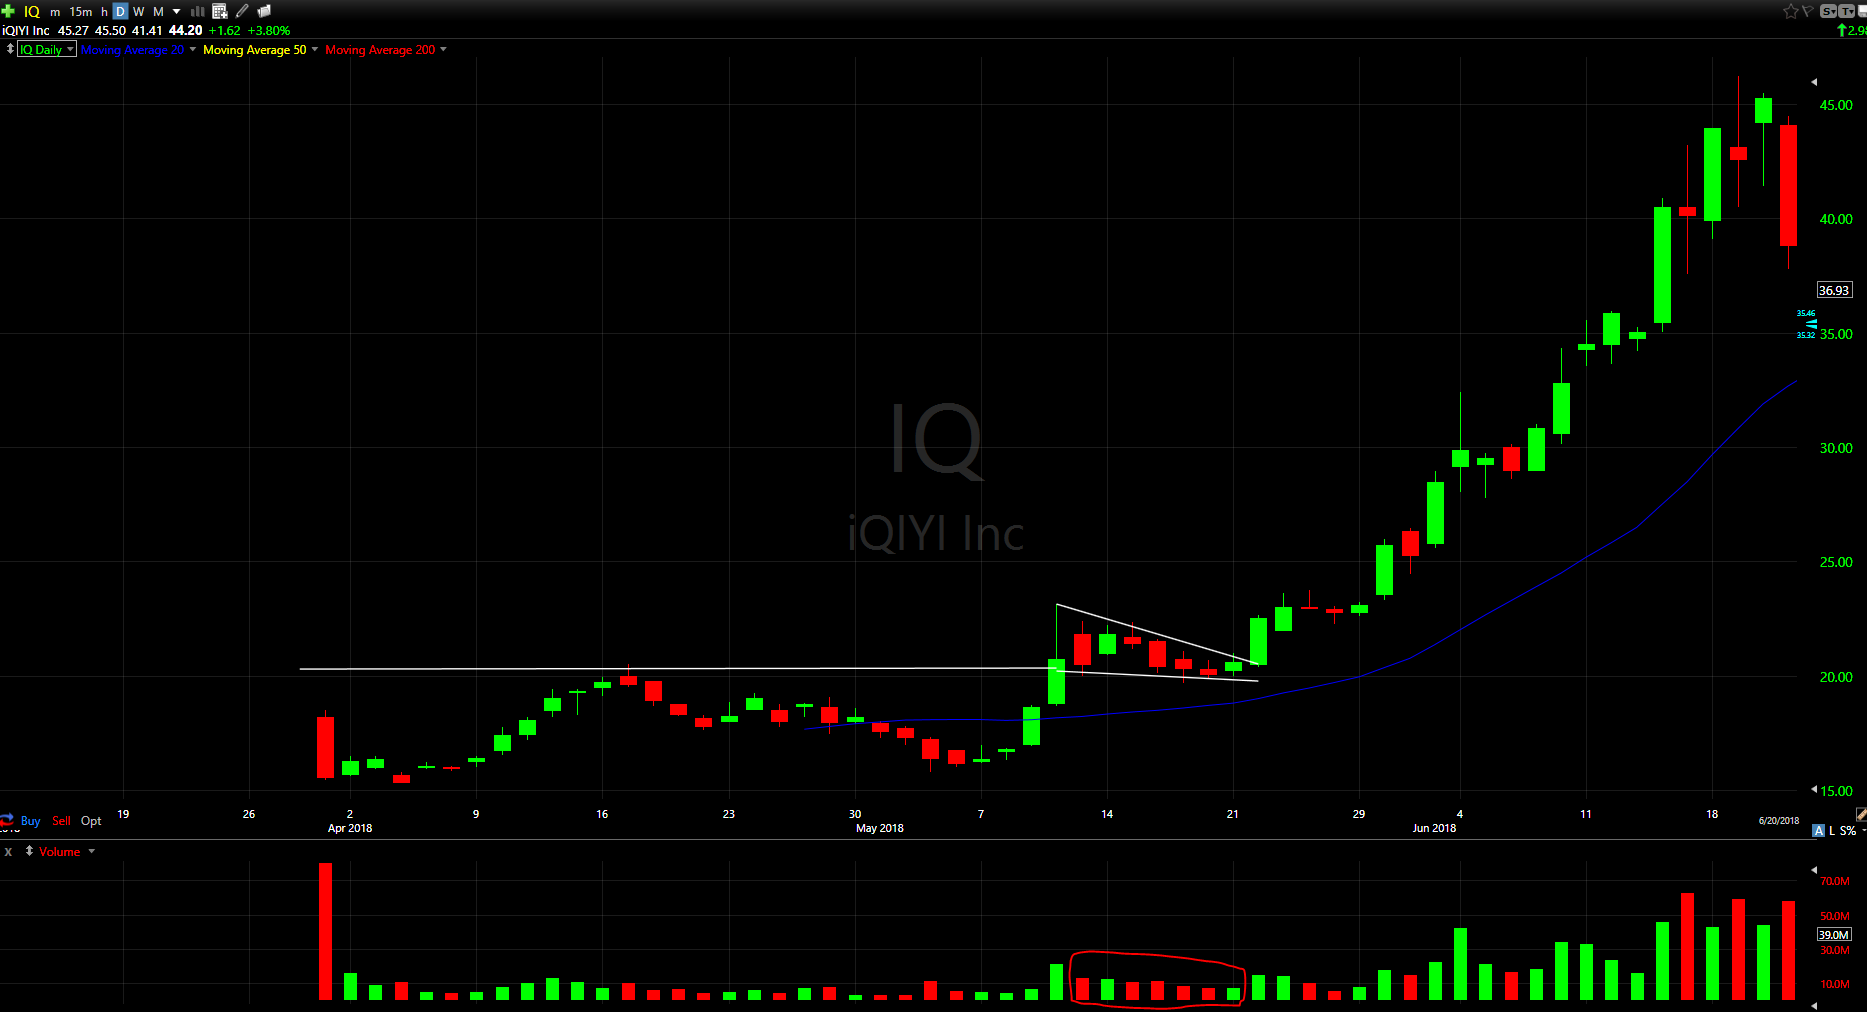
IQ is a great recent example of a textbook flag breakout. Check out its daily chart below:
IQ is a perfect example of a flag breakout. You can see how when it broke out of the flag in May it had no nearby resistance levels, since it was a recent IPO. It also had a pullback on much lower volume than the initial thrust, and it was holding up in the upper part of its range, and above the former all time highs. After it broke the flag it went from around $22 a share to over $45, an over 100% move in around a month. This shows the power of this pattern when everything lines up correctly. It is even better when the stock is a recent IPO, because there is so little chart history, meaning there is not many reasons for the stock to reverse after it breaks out.
Sign Up For The Free 4-Day Live Course
Trading breakouts seems easy looking back at charts in hindsight, but in reality it is a skill that takes time to master. We will go into more depth in our free 4-day live course later this month. If you missed our last post of the Bulls Elite Series breaking trading psychology, you can check it out here.
Reserve your seat for the free 4-day live course here.
PS if you’re coming let us know on Facebook and share this event with your friends. Click here to join our Facebook event.
[rf_contest contest=’10758′]


