One of the most common questions I get from aspiring day traders: How do you know which stocks that gap up will follow through, and which stocks will fade off all day?
We talked earlier this week about stock gaps and how to scan for gappers. Today we will discuss the main technical factors that affect whether a stock follows through on a gap-up or not.
There are 5 main factors that affect whether a gap-up will be sold into or bought up. You will want to have all 5 of these align to have a high probability of getting on the right side of a trend on a gapper:
Nearby Daily Resistance
Stocks that gap-up into resistance will often sell off when the market opens due to nearby supply. Gaps that follow through will typically have no nearby resistance, as they have less of a reason to reverse trend.
Before you buy any stocks gapping up, always check the daily chart to make sure there is no nearby resistance, and there is room to run. Typically you want to look at about 18 months of price history on a daily chart, and mark out key levels of resistance and support before the market opens.
Basing Period
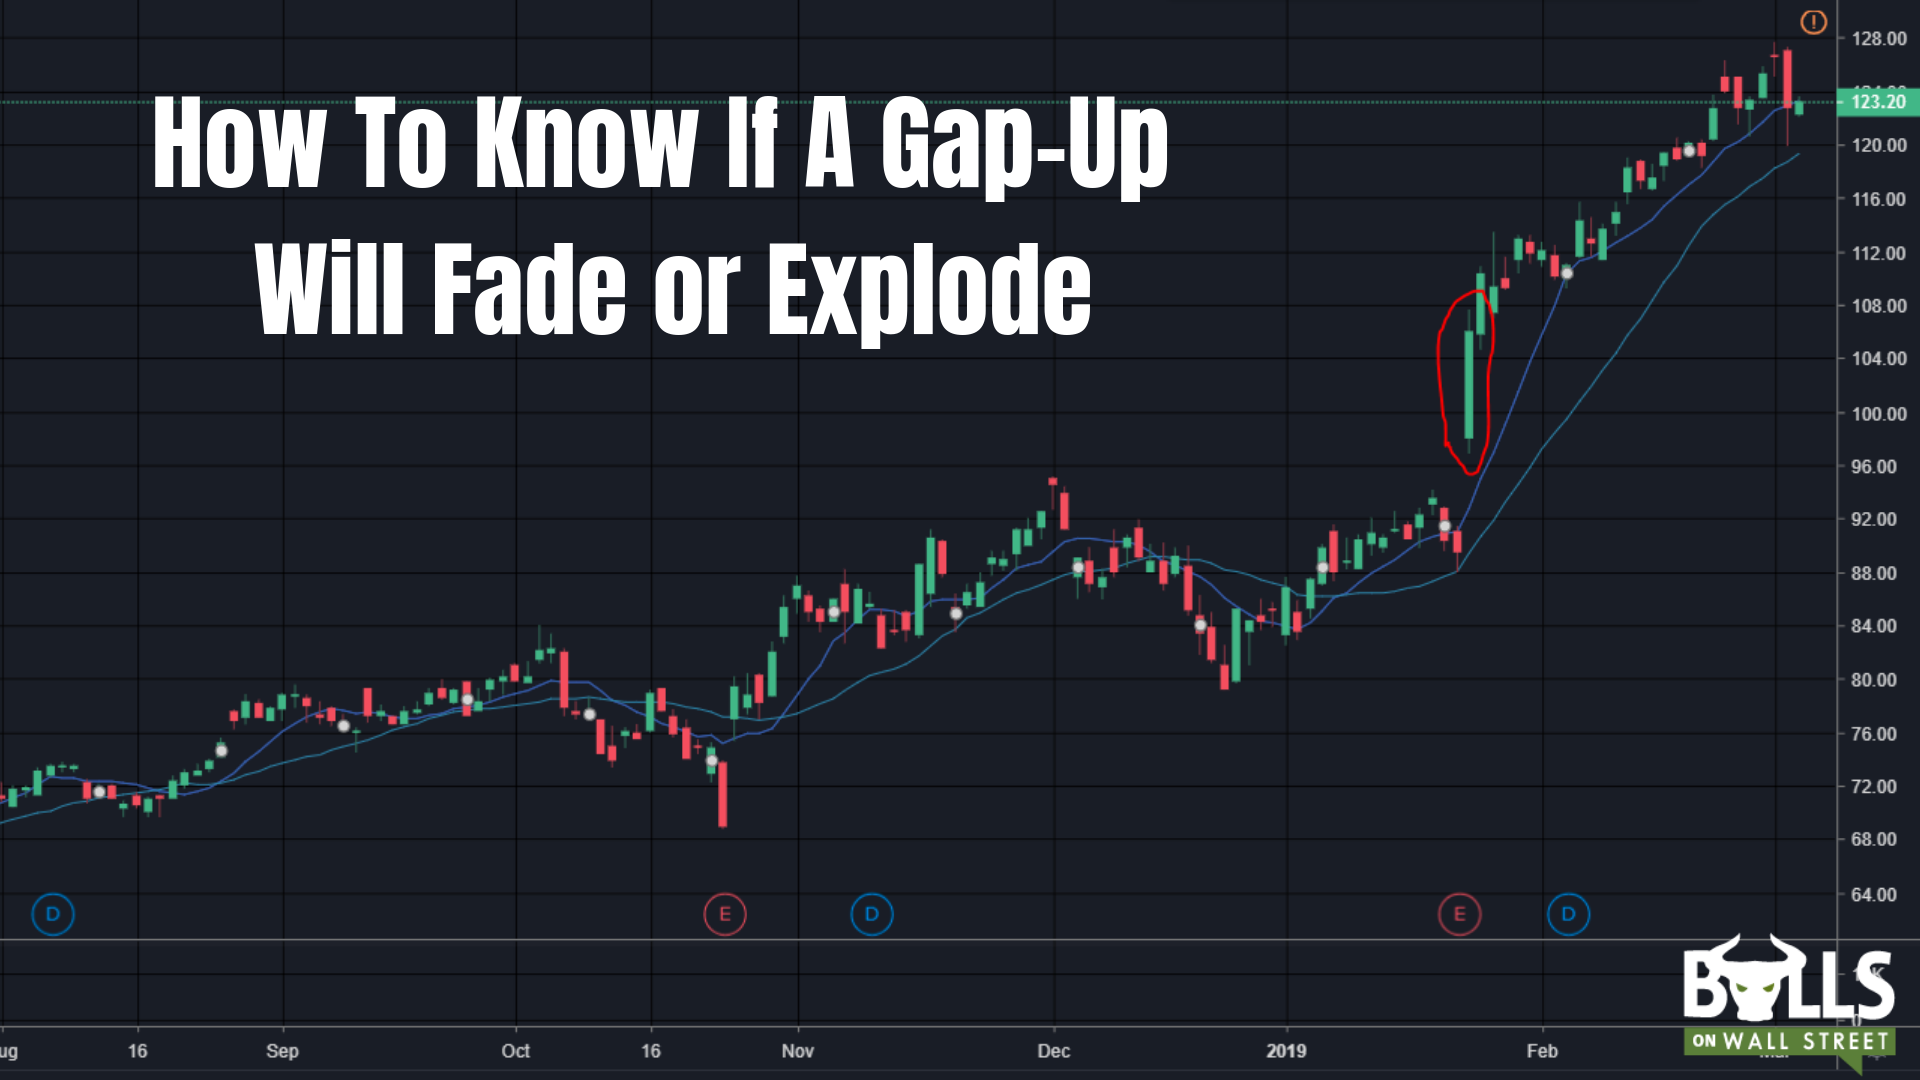
Stocks get their power from consolidation and bases. The best gap-up plays are usually preceded by a basing period of at least 1-2 weeks. This is a period where a stock trades sideways on low volume in a range. XLNX is a great example of a stock that had a great breakout gap after a long basing period:
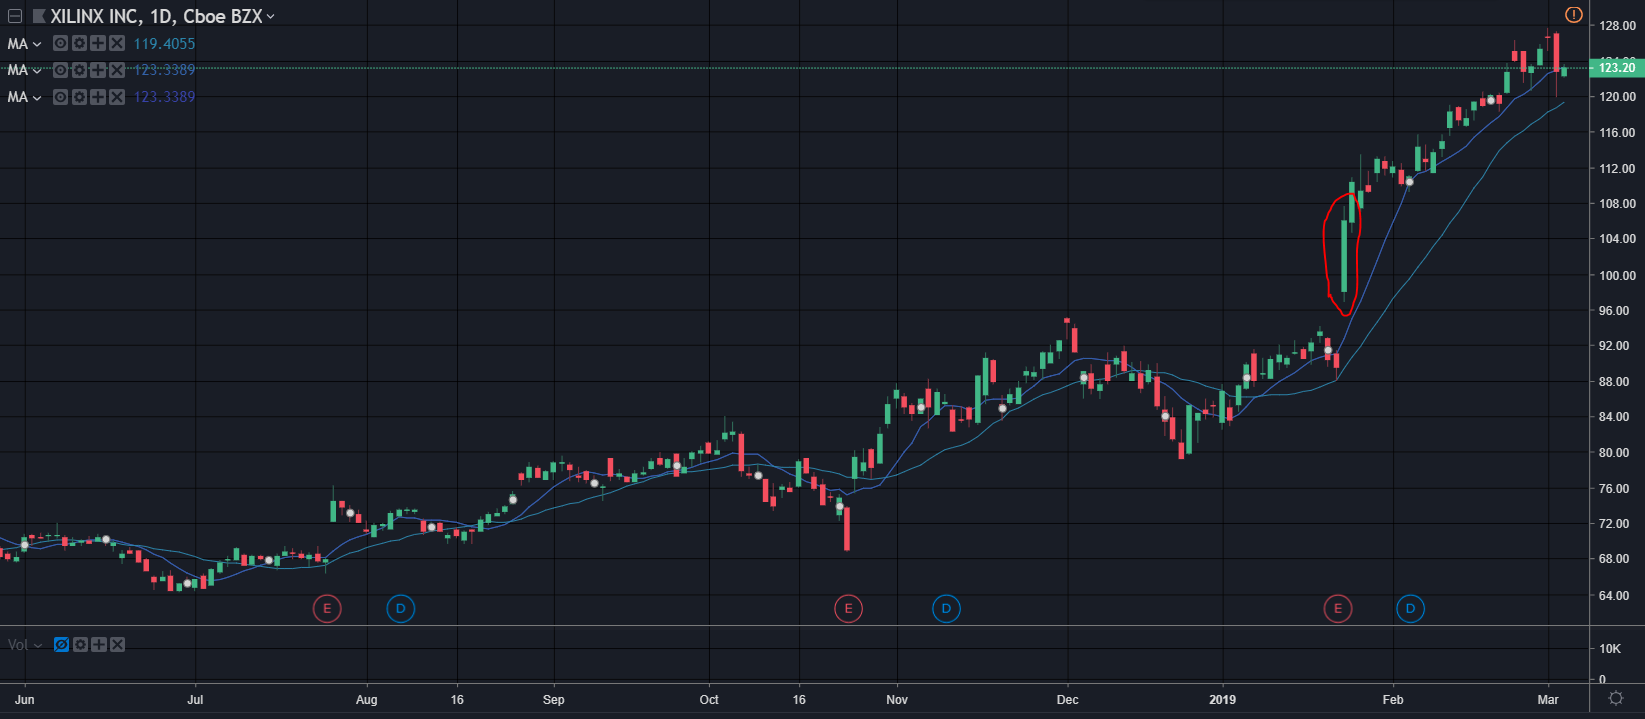
You can see how it was trading sideways and consolidating for about a 3 month period. The longer the basing period, the higher the probability of the gap-up following through. The long base in combination with an earnings breakout is one of the most explosive setups.
Catalyst
You should always know why a stock is gapping up or gapping down on a given day. On all the gappers you are looking to trade, you should take the time to look at Yahoo Finance or Finviz to see WHY they are gapping up and down. One of the best catalysts for momentum are quarterly earnings reports. Whatever the catalyst is, be sure to know why the stock is moving. Some catalysts are not conducive for momentum (Buyouts for example).
Daily Chart History
In addition to checking for resistance levels, you want to see the stocks big picture trend and see how a stock has behaved in past scenarios. Stocks that have a history of selling off into gaps will likely do it again. Stocks that have a history of following through on gap-ups will likely do it again. History tends to repeat itself in the stock market.
Also, look at how the stock has behaved in the past with a similar catalyst. For example, if you were looking to play XLNX a few weeks ago, you would go back on its daily and see how it traded after its past earnings reports. You would see that it has had strong days in the past on positive earnings reports, meaning it is likely to do so again.
Pre-Market Trend
A stock’s pre-market trend will be a strong indicator of how the stock will behave once the market opens. Uptrending price action in pre-market will often have strong price action once the market opens. If a stocking gapping up is fading off hard in pre-market, it is likely it will continue to fade off when the market opens.
Don’t fight strong pre-market trends. If there is no obvious pre-market trend, wait to see how the stock behaves when the market opens, and join the trend versus trying to guess which way the stock will go. If you are new to trading gapping stocks, wait for a few candles to form before jumping in.

