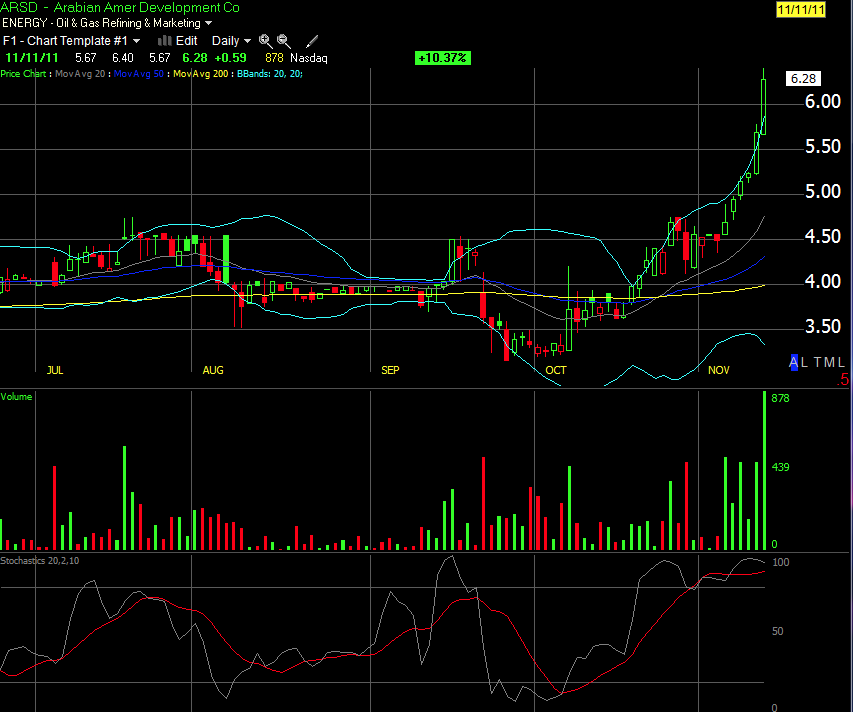
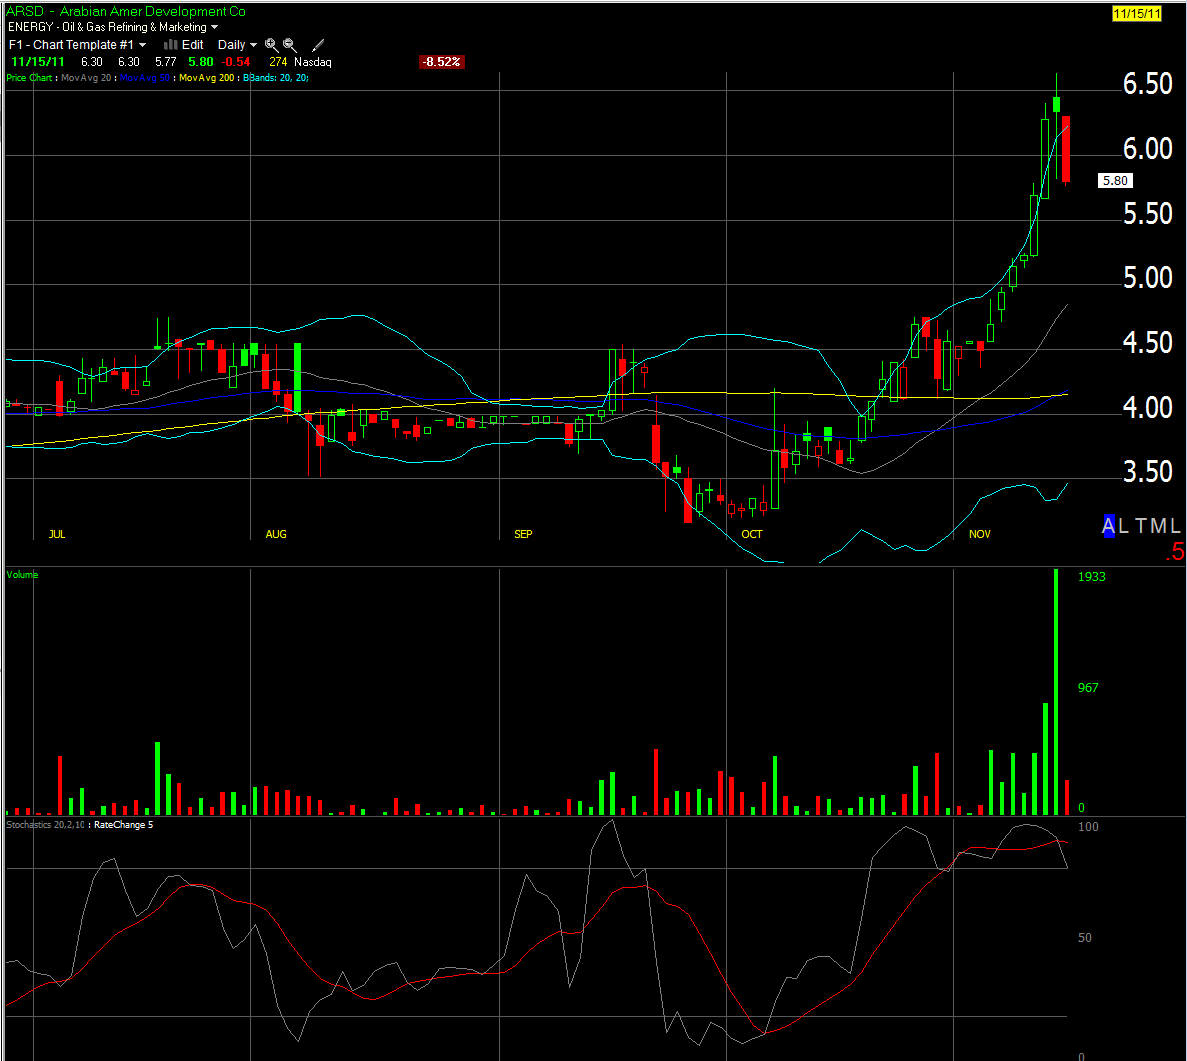
Hey folks! I received a lot of questions about my $ARSD trade, so I decided to write a blog post breaking it down.
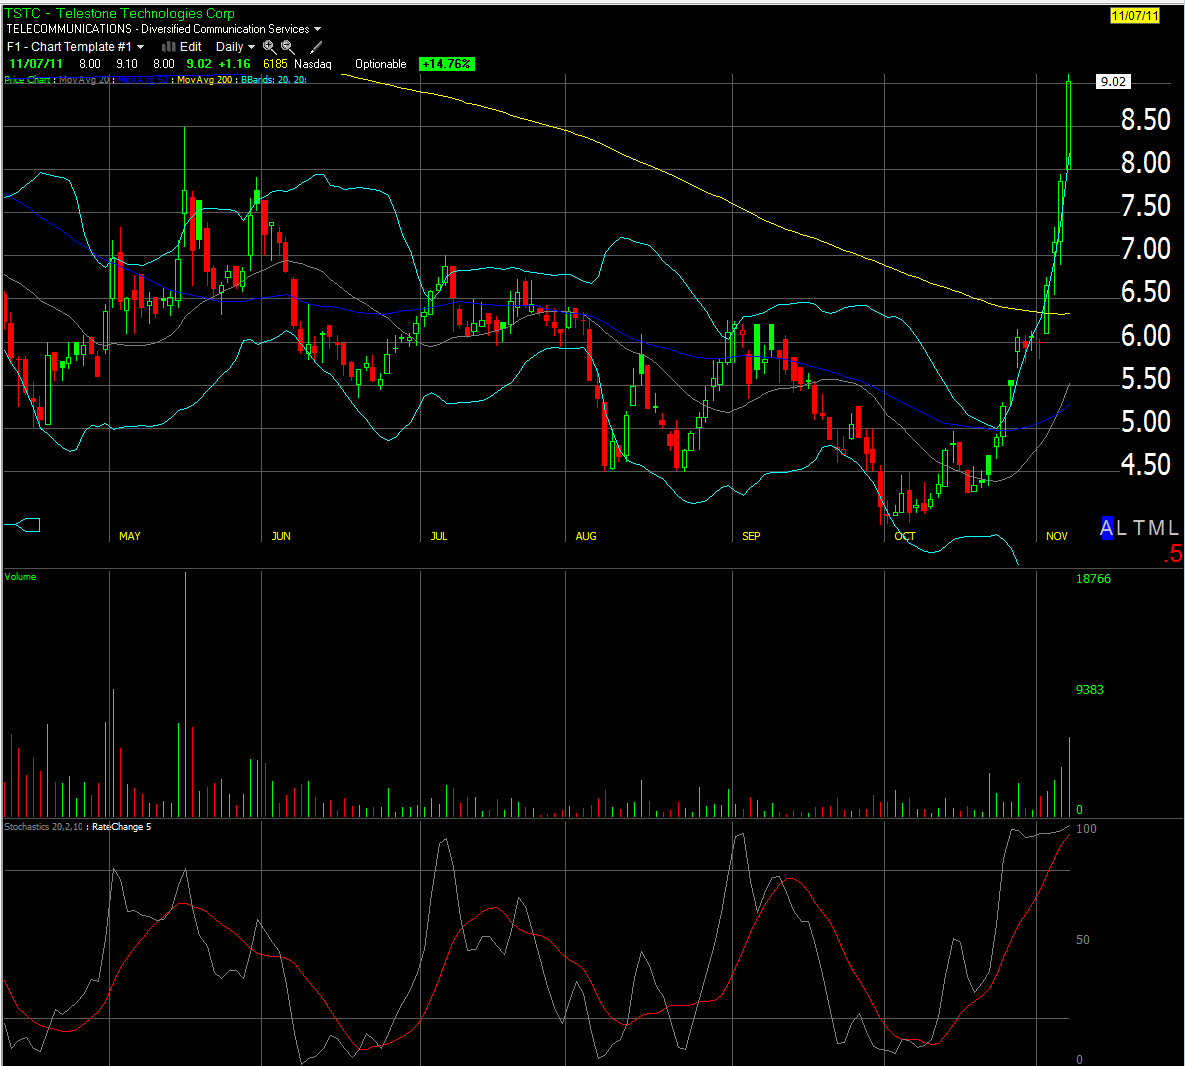
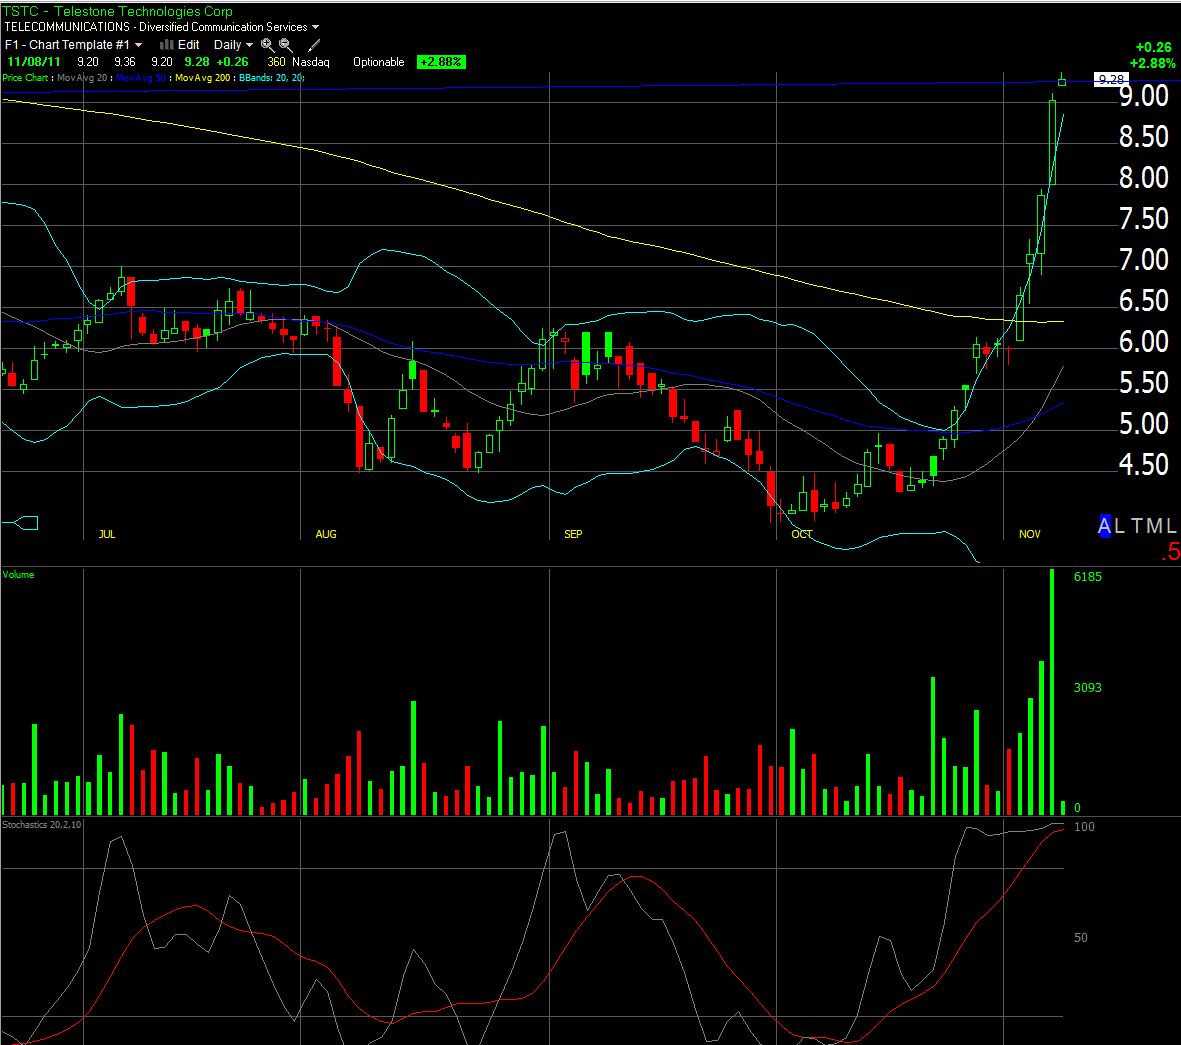
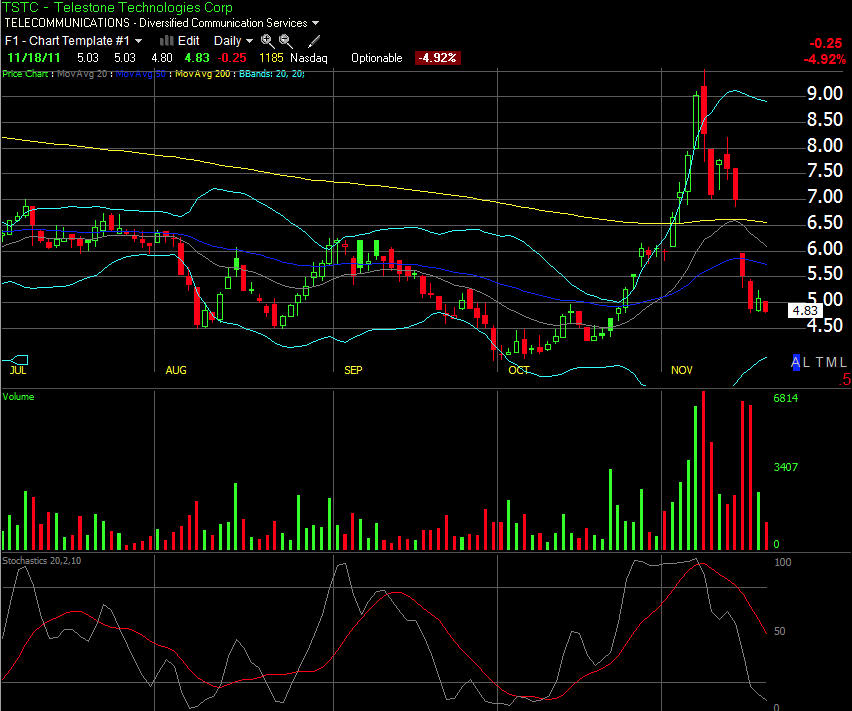
The stock broke out at $4.60 on the chart and ran on high volume. I missed the break on the chart, but noticed that it was screaming higher for seven days in a row! The stochastics were right at 100 which means the stock was extremely overbought. When you see a chart that looks like this, you want to plot the Bollinger Bands (settings at 20,2) and wait for the candle to get completely out of the upper Bollinger Band. In other words, no part of the candle is touching the band. When this happens, the stock has a huge chance of failing. What I do is wait for the stock to go red on the day, and then enter for a short. Going red is what confirms the move for me. This setup was also perfect on $TSTC a few weeks ago; we played it and the stock tanked from $9 to $5 in a matter of days! I forgot to save a shot of $ARSD when it was out of the upper Bollinger Band, but I saved one of $TSTC so you can see what it looks like!
When you are scanning, look for stocks that have had a huge run-up and are close to being out of the upper Bollinger Band. Then you put it on your watchlist and if it gaps the next day, you check and see if it’s out! If it is, you short the stock when it goes red.
I saw this on my scan the night before, so I set my alert and waited for a gap up out of the band.
The stock gaps completely out of the upper BB.
I shorted the stock when it went red; it tanked for the next several weeks.
This is what I saw on $ARSD when I ran my scan the night before. The stock gapped the next morning and was out of the band. I alerted myself for a red move. When it went red, it tanked shortly thereafter.
This type of setup is only good for stocks that have climbed higher over many days. Two big candles on a daily chart can often produce an out of upper Bollinger Band situation, but this is not the setup we are looking for. Oftentimes a stock that runs up really high on one or two candles is a news play and there is no predicting when it will fall. You want a stock that has run up for multiple days and is then really overbought and out of the Bollinger Band! Hope this helps! I’m happy to answer questions you might have at maribeth@bullson.ws
