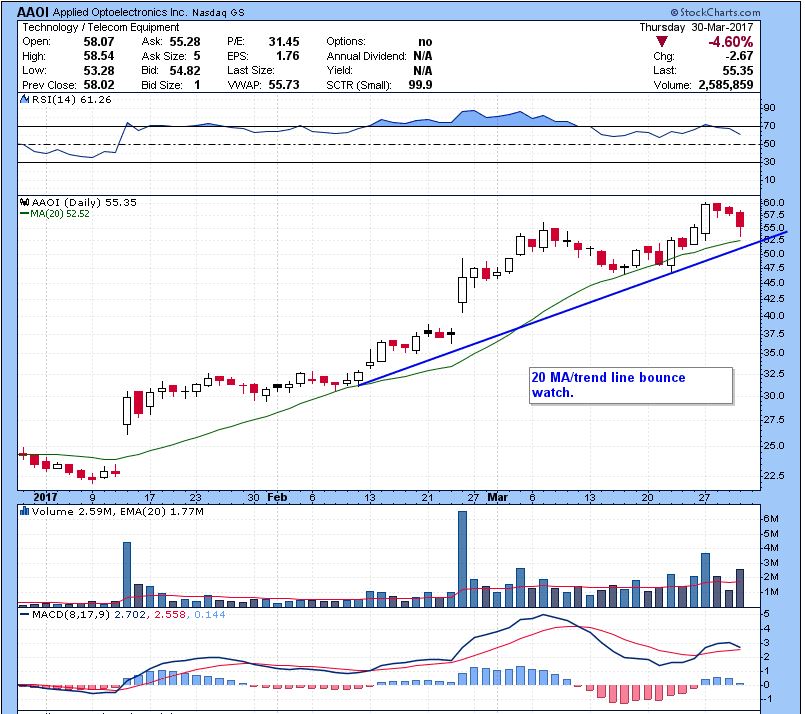
Recently we published a previous article on Aligning Multiple Timeframes. Well our own Szaman must’ve read it, because he made a killer trade today doing just that! In case you don’t know, Szaman is also one of the moderators of our chat. He calls out trade opportunities to everyone in the chat as he’s placing his trades. On March 30th, he practically called out a trade on $AAOI that was perfect to the t!
AAOI’s Multiple Timeframes
At around 10:00AM Szaman called this trade out when $AAOI was dipping really hard. After a series of red candles, the stock dropped right to $55. But, if you take a look at the daily chart, the $55 level is right at previous levels of resistance. On March 7th and March 24th, this area acted as resistance pushing the stock down. But on March 27th, $AAOI blew right past it into new highs. But as you may know, previous levels of resistance now have the potential to act as support. To double the probability of a bounce, the daily chart also had a nice clean ascending trendline as well as the 20 Day Moving average.
After a few days, the stock started to pullback. Watching $AAOI’s intraday chart he saw the strong drop right to $55. But it now fell too hard and right to support. The stock was now extended and it began to show strength here. Szaman called out the trade and entered at $55.50. As soon as he got in, $AAOI popped all the way up to $57.25 allowing him to scale out for some nice gains before fading the rest of the day.
In case you didn’t know, Szaman is also in charge our our daily trading watchlist and AAOI has been on our radar for a while now. If you were in our chart you could’ve been alerted to this trade! If you’re not sure of the setups and price patterns that we’re talking about you can learn them all here at our Bulls Bootcamp. It’s an intensive 60 day course to teach you exactly how I trade and why. To learn more or signup, email me at kunal@bullsonwallstreet.com today!


