On March 27th, we placed a trade on $NVDA for some decent gains. But we didn’t just enter into $NVDA randomly, we used a rational approach to prior to the trade by aligning multiple timeframes. We generate our initial trade ideas by primarily looking at the daily chart. Once the stock breaks over or under a certain level on the daily chart we have step 1 of our game plan. We then zoom into an intraday chart to time our entries and exits perfectly while keeping the longer term timeframe in mind. By using this top down approach we’re able to gain the edge we need to come out as winning traders at the end of each day.
If you look at $NVDA’s daily chart, you can see that it was trending higher between $95 to $110. After consolidating for the last few days however, the stock broke the trend when it gapped down that morning, opening at $105.50. This weakness is what gave us our first clue to our trade bias in the stock.
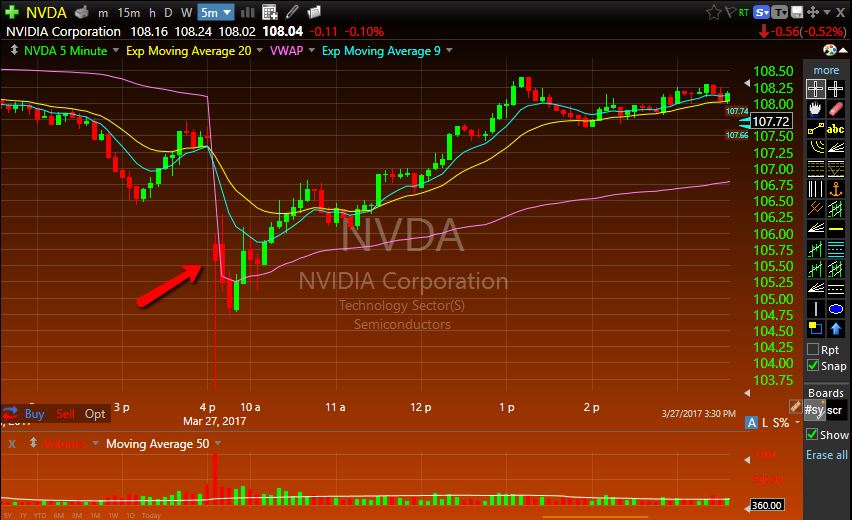
But that’s only the first part of the equation. Next we need to be patient and look for a valid setup intraday in order to know exactly when to time our entries. After a quick sell off in the morning, the stock bounced to $106.25. It’s this type of bounce we were waiting for before shorting into the price drop. After it broke underneath the morning moving averages we entered the trade for a quick morning flush from $105.50 level to the low $104.00s.
If you’re not sure of the setups and price patterns that we’re talking about you can learn them all here at our Bulls Bootcamp. It’s an intensive 60 day course to teach you exactly how I trade and why. To learn more or signup, email me at kunal@bullsonwallstreet.com today!
