The most important thing you can do to improve your trading is to review your own trades. A deep dive at the end of the year into your trading results is critical to improving your trading performance. By reviewing, you learn how to repeat what you did right, and learn what not to do and how to make key adjustments to your trading approach.
While you should review every single one of your trades in the order you took them, I always start with analyzing the biggest winners and losers of the year. These trades have the most impact on your overall results and provide insight to your strategic and emotional approach to trading.
Today I’m going to show you exactly how to do this by analyzing our Bullsonwallstreet Swing Trading Results. We will break down the 5 biggest winning and losing trades of 2020. Let’s start with the macro results.
Big Picture Results
Here is the break down for the overall stats for our 5 biggest winning and losing trades:
Total gains $15270.
Total losses $11204
Net gain +4030 (+4%).
Average gain $3054
Average loss $2240
Reward to Risk ratio 1:4 to 1
The first thing I want to know when reviewing my biggest winners and losers is which side came out ahead. In essence, you’re assessing whether the added volatility helped or hurt you.
We had a net gain of $4030, or 4%, over the course of 10 trades. The average win was $814 more than the average loss, and we made on average $430 on earth trade ($4030/10). This gave us a risk-reward of 1:4:1. While ideally, I like to be winning at a 2:1 ratio, our risk ratio was pretty good. We won the volatility game.
While this is good, there is room for improvement.
Next year, I will work hard at decreasing the average loss size. This year, if it had been at a 2:1 rate, the average loss would have been $1500 instead of $2240. That would have increased profit from $4030 to $7530, or $753 per trade.
Analyzing the Trades
Now that we know the big picture results, we move to the micro.
When analyzing trades, I like to go back and understand why I took the trade. I ask myself if it was a good plan. Factors include the overall market and sector, quality of the setup and risk ratio. This all relates to the process.
Next, I analyze the outcome or result. I want to know if I executed the trade properly. If the process is good and execution was on point, the trade grades positively regardless of the outcome. On the flip side, a bad process with poor execution is a bad trade even if the result was positive. The key here is to focus on process and execution, not the result.
Here are the 10 Trades (all alerts to Bulls Swing Members)
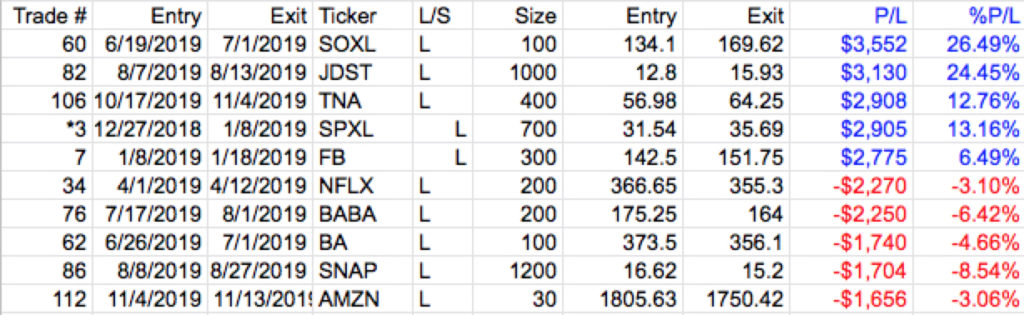
Top 5 Winning Trades
The SOXL Trade
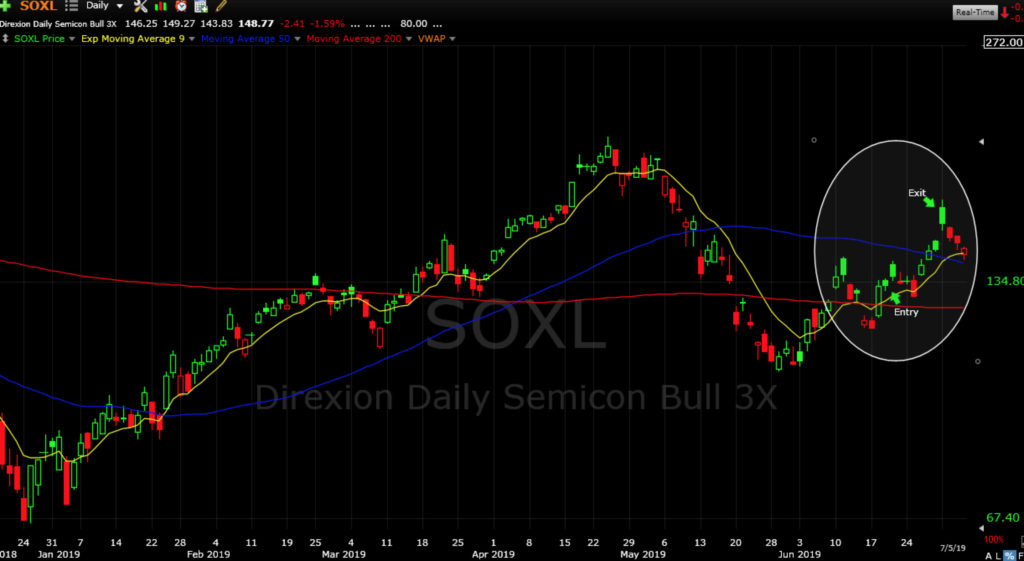
The game plan: The semiconductor sector was showing relative strength throughout early 2019 and pulled back hard after a 4 month run. This is common in big trends. On the pullback I look for potential trend continuation, which SOXL exhibited as it remounted it’s key moving average. This lead to the trend-pullback continuation setup entry. The reward to risk was 2:1, with potential for more if the stock reached the previous high. The game plan was solid.
The outcome: The plan was not only executed, but we got more than the anticipated 2:1. We exited on the “exhaustion gap” that lead to a pullback, ending the trade with an executed 3.5:1 reward to risk ratio.
Grade: A
The JDST Trade
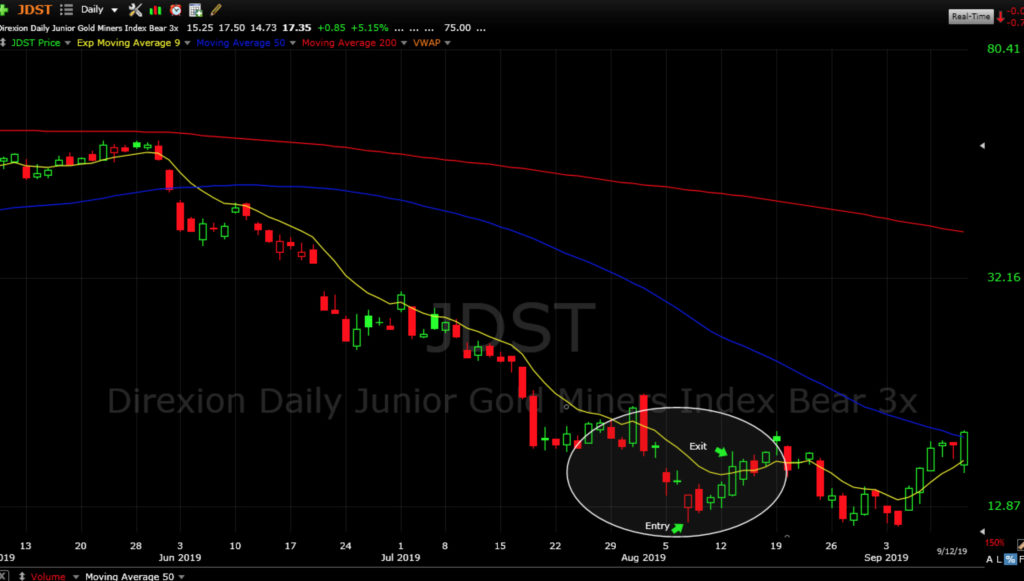
The game plan: JDST is an inverse ETF, which is a bearish play on gold miners. This ETF will go up when gold miners go down. Since gold and gold miners were going parabolic, JDST was getting crushed. On the day of entry gold miners put in an inverted hammer. That gave us a reversal hammer candle at extreme conditions in JDST. This is a textbook “rubber band” reversal setup. Target was the open gap of the previous price range, which would give us 4:1 on the trade.
The outcome: This trade was about as good as it gets. Price went straight to our target range before pulling back.
Grade: A
The TNA Trade
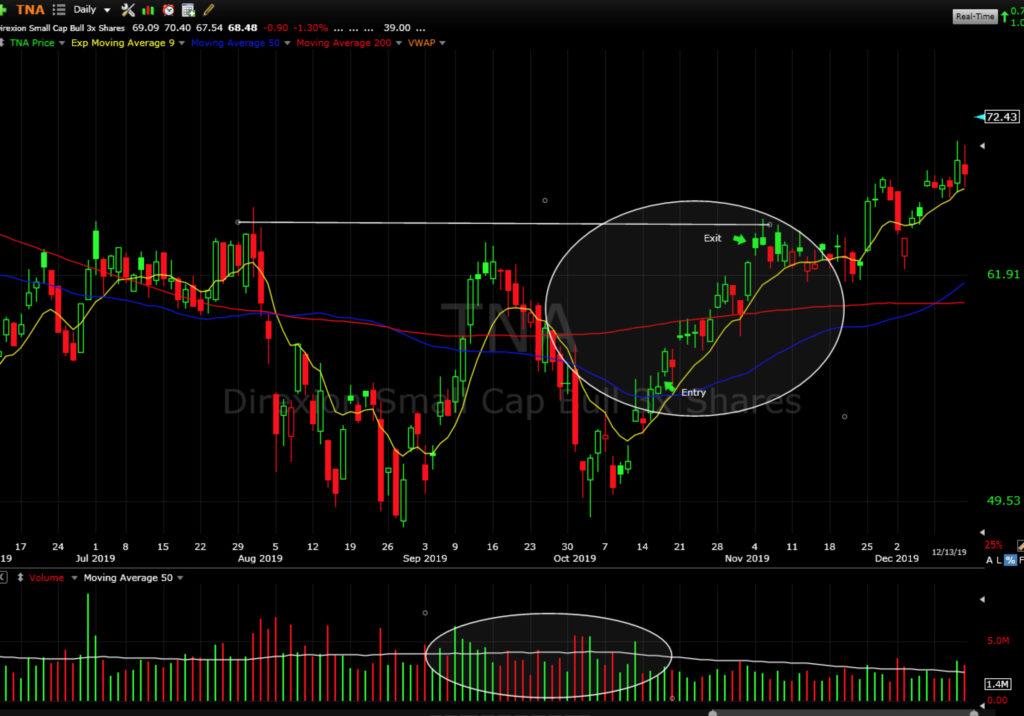
The game plan: TNA is the small-cap leveraged ETF. Small caps had been trailing the S&P500 for much of 2019 until this point. In late summer small caps started to pick up steam and show relative strength to the overall market. Strong volume indicated accumulation. At this point, a “W” formation formed and price remounted the key moving averages. Entry was on remount and target was the top of the 2019 range. The reward to risk was a strong 3:1.
The outcome: Price hit our target within 3 weeks with only minor pullbacks, and we executed the planned 3:1 reward to risk.
Grade: A
The SPXL Trade
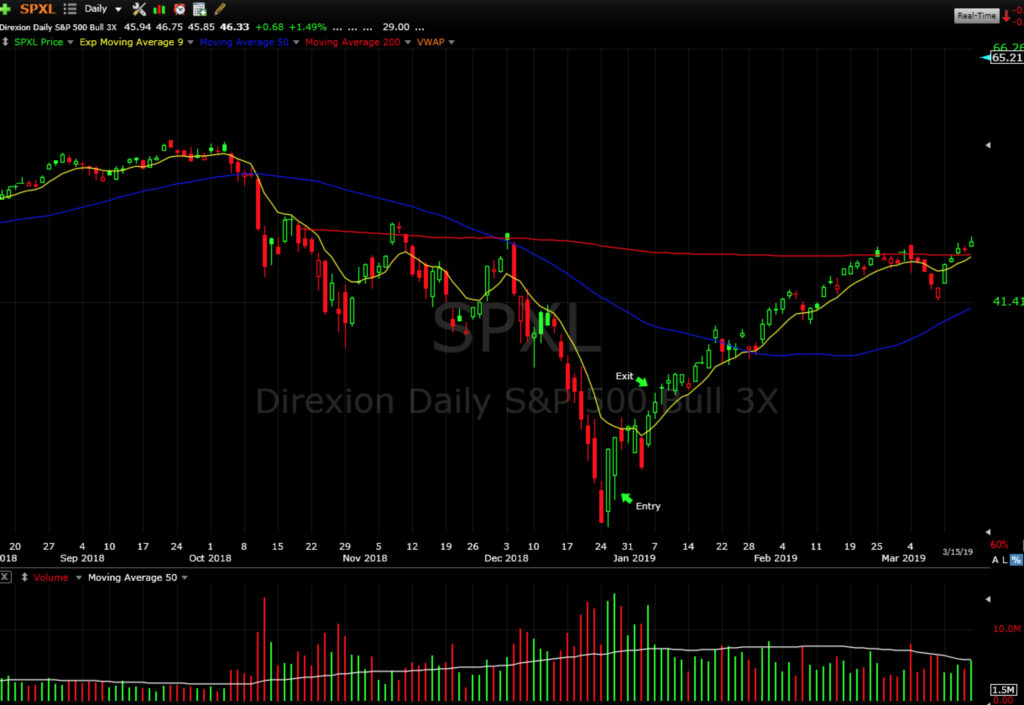
The game plan: The market had tanked from October 2018 to the end of the year. After Christmas we had a blow off bottom as the market went into complete fear mode on a selloff at already extended levels. The ensuing bullish engulfing candle pattern was the clue for our entry. Target was below the November-December support/resistance range for a 3:1 RR.
The outcome: After one scary pullback 4 days after entry, price zoomed to our target level. Looking back, while this was an excellent 3:1 trade, we could have made the target higher at the 50ma.
Grade: A-
The FB Trade
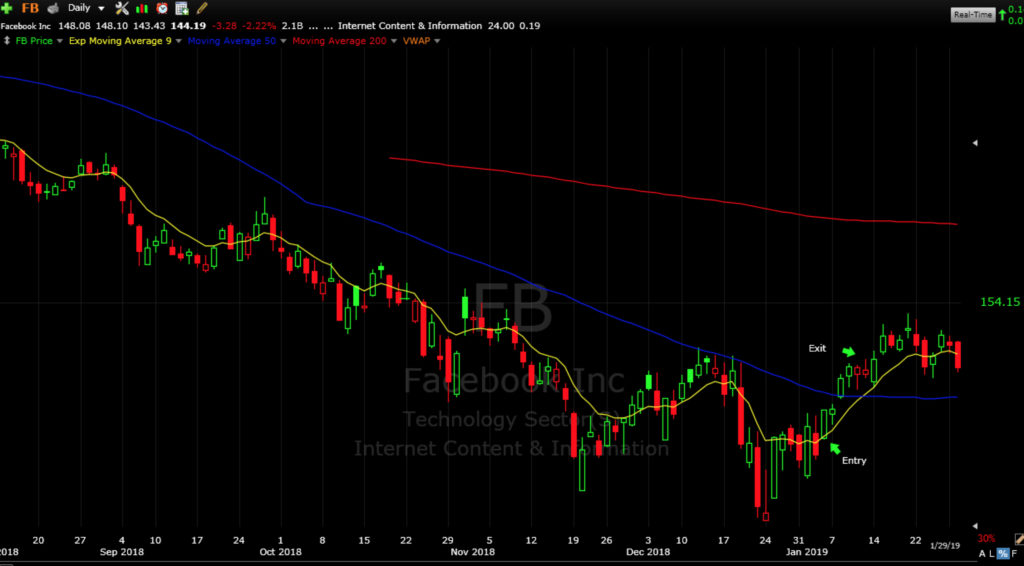
The game plan: This was a similar trade to the above SPXL trade. The October-December meltdown took almost all stocks down with hit. Entry was similar to SPXL with the same risk profile.
The outcome: Price went straight to our target range. Like SPXL, we could have let profits run a little more.
Grade: A-
Top 5 Losing Trades
The NFLX Trade
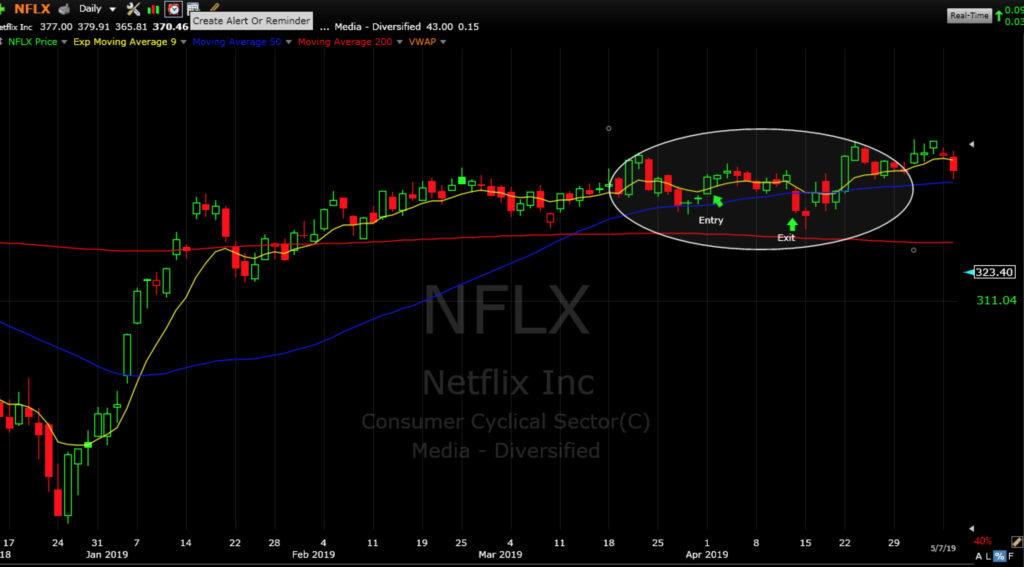
The game plan: This was a classic trend continuation play after a long consolidation, on remount of the 9ema. The market and sector looked good. The reward to risk ratio was around 2.5:1.
The outcome: Price did not reach the target level and pullback back hard to our stop. I was stubborn and loosened stop way too much. This a theme for my biggest losers. The setups are good and it’s okay to get stopped out of good setups. But I should not be taking on extra risk.
Grade: B-/C+ (good game plan, poor execution due to stop adjustment)
The BABA Trade
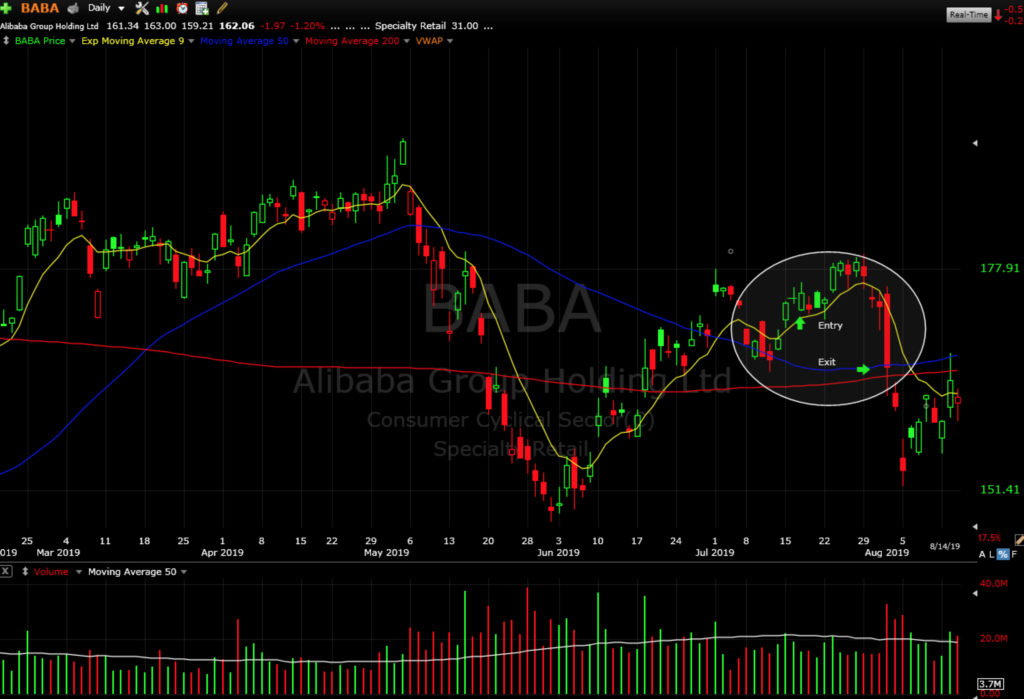
The game plan: A classic trend continuation in a stock that was showing a strong accumulation pattern. Good risk ratio and target range at recent high made sense.
The outcome: Price achieved target range, but I went for the bigger win. Is this green or did it make sense? Honestly, it’s tough to tell but at the least, I should have moved my stop up to break even to make sure profit did not turn to loss.
Grade: C (The game plan was good and target achieved, but poor execution)
The BA Trade
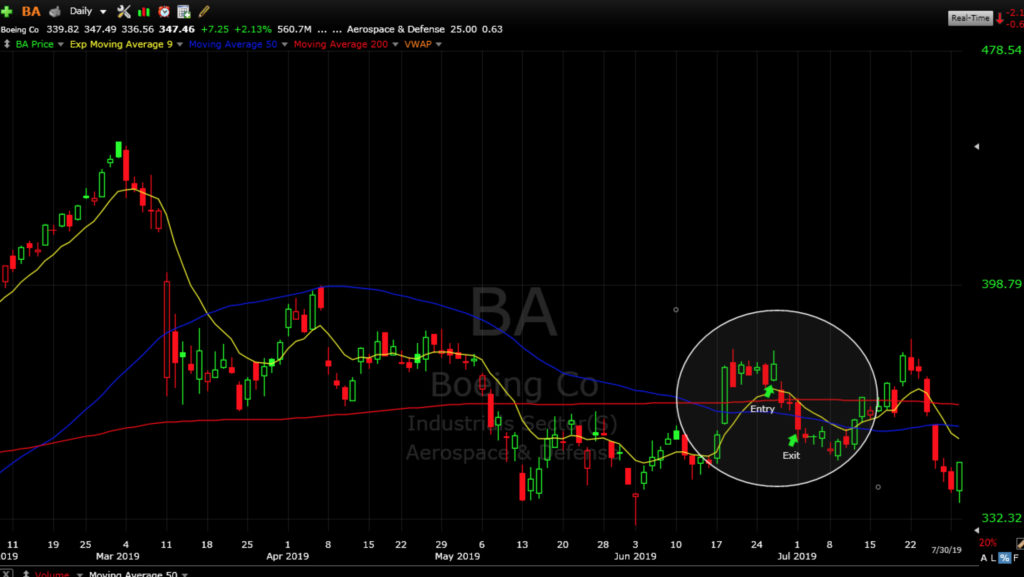
The game plan: The stock had gapped down and looked to be bottoming. A new breakout over moving averages was consolidating into a high tight flag setup. Risk was around 2.5:1.
The outcome: The stock blew through stop level and I allowed it to slide in case of an overreaction reversal. Looking back, that was a mistake. Not only that, but considering the bad news, I may have been overly ambitious with the setup. I could have waited for the big down gap to fill before considering BA.
Grade: C
The SNAP Trade
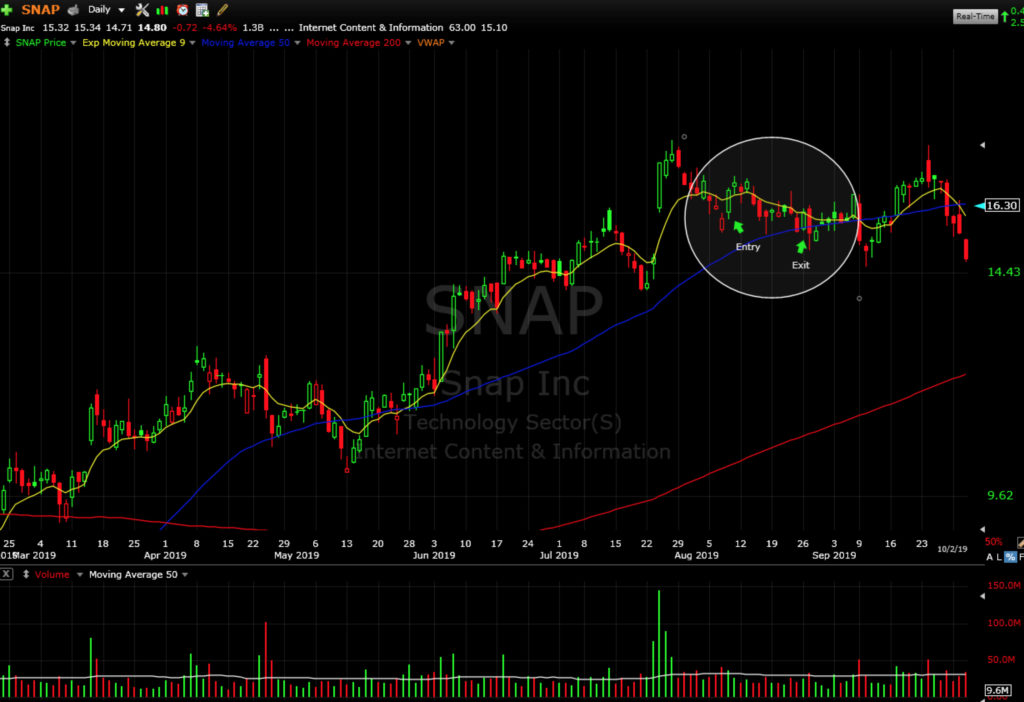
The game plan: Textbook earnings breakout-pullback setup on strength at the bottom of the range. Target level was the top of the range. Reward to risk was 2.5:1.
The outcome: The stock pulled back to stop level and took me out after I had loosened it some to adjust for the moving averages. The stock then quickly hit the target range after I was stopped out. I could have adjusted position sizing smaller and allowing for a wider stop.
Grade: B
The AMZN Trade
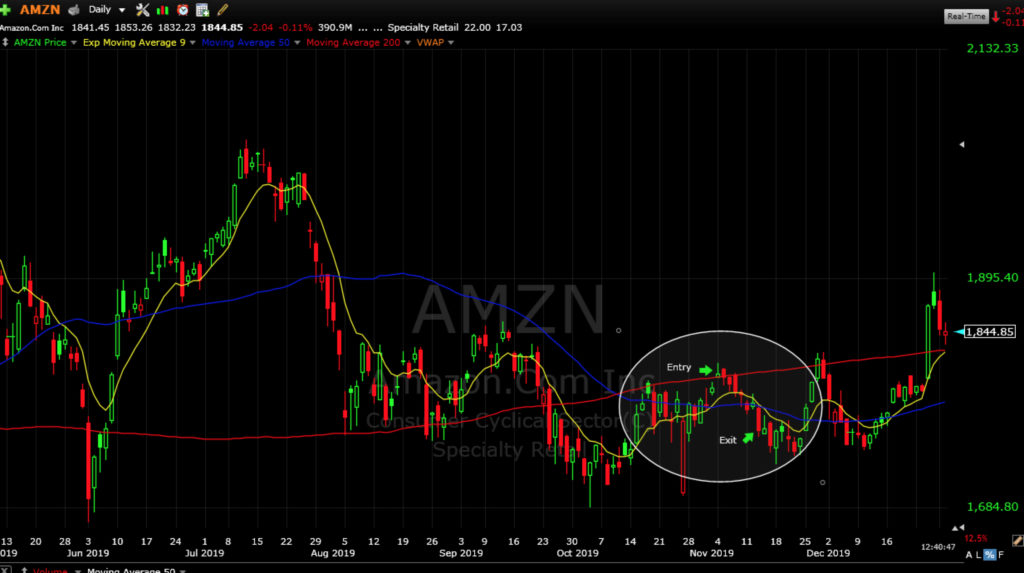
The game plan: Bottoming play after the stock had gapped down and made a strong reversal and remounted the key moving averages.
The outcome: The entry was high as the remount failed and price pullback back to stop level. I loosened stop in anticipation of a hole of the reversal candle that did actually happen. I was correct about the reversal, but after I reached my max pain threshold for exit.
Grade: B-
Get 50% Off All Day Trading and Swing Trading Packages Until Jan 1st

Click Here to Get 50% Off All Our Trading Educational Packages
