The “FAANG” stocks are 5 of the most influential stocks in the market. To illustrate how important these stocks are, if the Nasdaq 100 (QQQ) was equally weighted, 5 random stocks would make up 5% of the index. However, Facebook, Amazon, Apple, Netflix and Google make up a whopping 30% of QQQ.
You could say as the FAANG goes, so goes the Nasdaq.
As we head to the end of the year, let’s take a look at the performance of each individual FAANG stock, and identify one potential monster trade in each for 2010.
2019 Performance
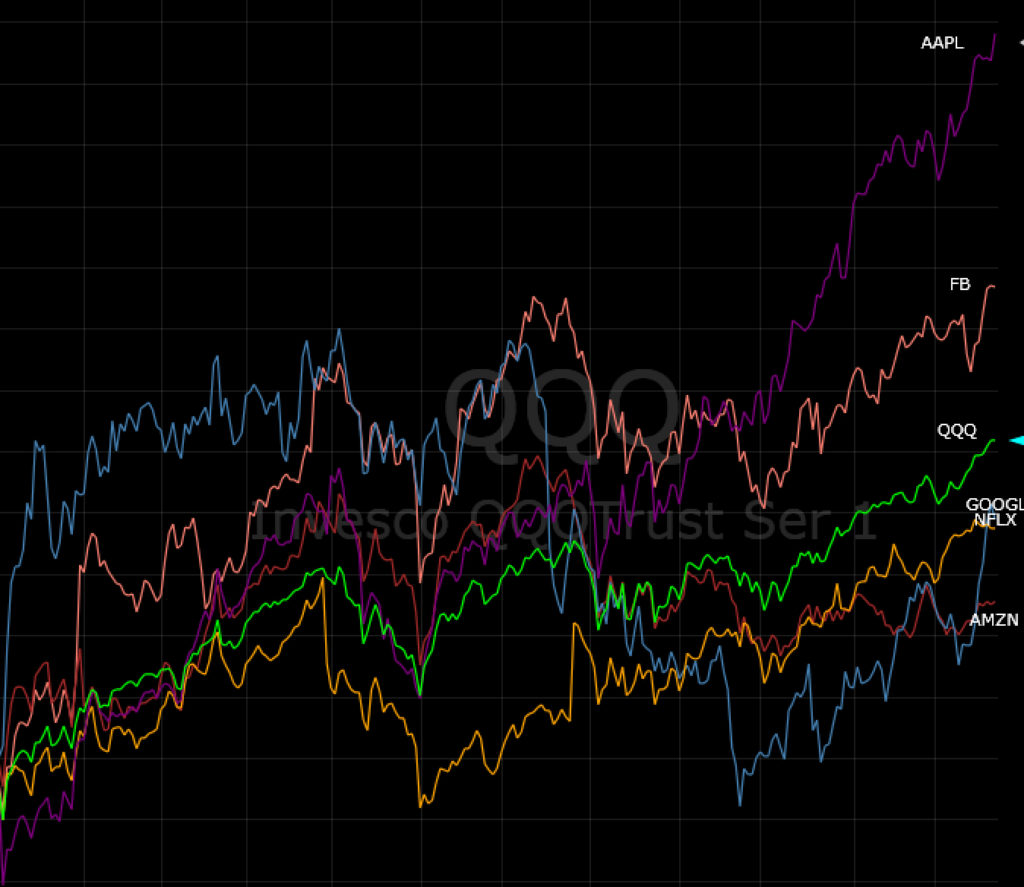
Let’s take a look at the “big five” and compare them to QQQ, which is up 37%.
Equally weighted and in aggregate FAANG is up 41%, beating QQQ by 3 percent. Just like we said before, as FAANG goes so go the Qs.
However, there’s an interesting dynamic in play between the FAANG. Only two of the FAANG stocks (Apple and Facebook) are actually beating QQQ, yet those two alone make up 17% of QQQ.
The best performer of the year was Apple, and it’s not even close. As of December 23rd it is up 78%, starting the year at $157 and rocketing to the current price at $280.
Facebook is up a whopping 57% in 2019 despite being the most divisive of the FAANG stocks. Between privacy issues, political backlash, and the idea that it’s no longer trendy, the stock continues to gain subscribers, beat it’s competitors and lead the market.
Google is up 30%, and I’m surprised it’s not up more. They have huge revenues and earnings, and between search, cloud services, phones, computers and artificial intelligence has it’s hands in just about everything.
So why is it lagging QQQ? The main culprit is anti-trust concerns. That being said, I wouldn’t be surprised to see it lead in 2020.
Netflix is up 25% amid concerns that it’s competitors will take subscribers and profits away. The biggest rival is Disney, which just launched it’s new streaming service.
The biggest laggard of the group is Amazon, up a meager 19% when compared to QQQ’s 37%. Not only is it behind the Nasdaq, but it’s also lagging the big box retailers that it’s crushed over the years, like Target, Walmart and Costco. However, the chart remains technically strong and could springboard in 2020.
Here is the comparison chart:
2020 Setups
Now that we know how they performed in 2019, we need to analyze how to trade them in 2020.
Remember, past performance does not predict future success. As the 2019 chart shows, FAANG stocks that took the lead early in the year did not necessarily finish strong. In fact, the big winner, Apple lagged out of the gate. Meanwhile, Google started with a big lead and finished behind QQQ.
So it’s not as simple as loading up on Apple and lightening up on Amazon. Instead, we need to analyze the chart technicals and come up with an early plan. We also must be adaptable with a “plan A” and “plan B” for each.
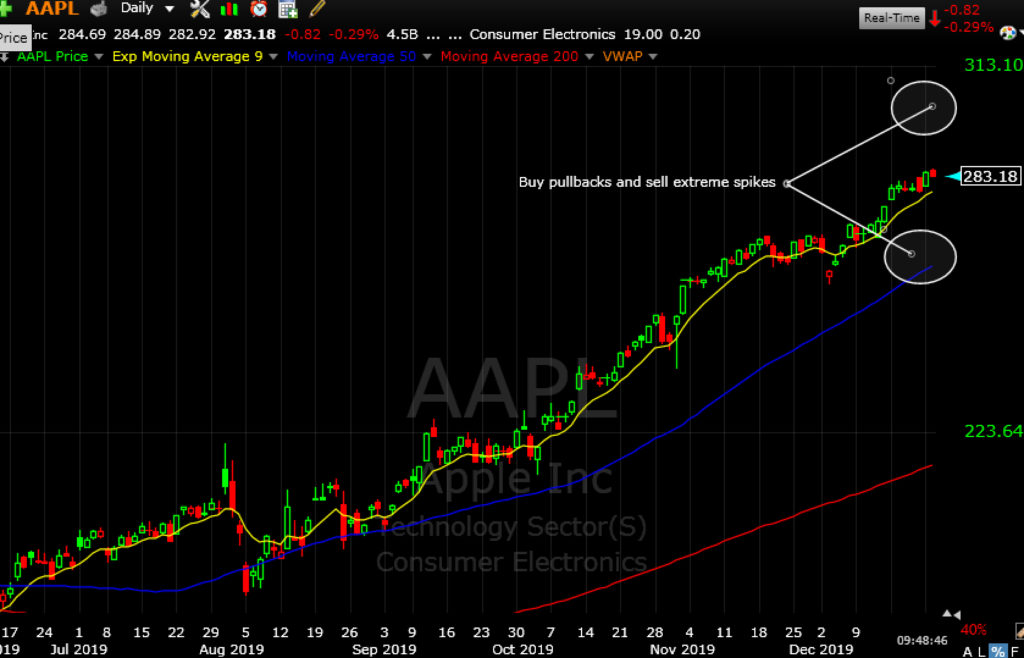
Apple has been on a huge tear and at this point is very extended. This makes the stock ripe for a deep pullback, but that doesn’t mean the stock can’t keep going higher first. This is a great example of a “plan A and B” stock. We have a plan, but are willing to adapt to a secondary strategy. The strategy here is to go long on any pullback that shows strength at support, while ready for a strong reversal candle at extended levels to go short.
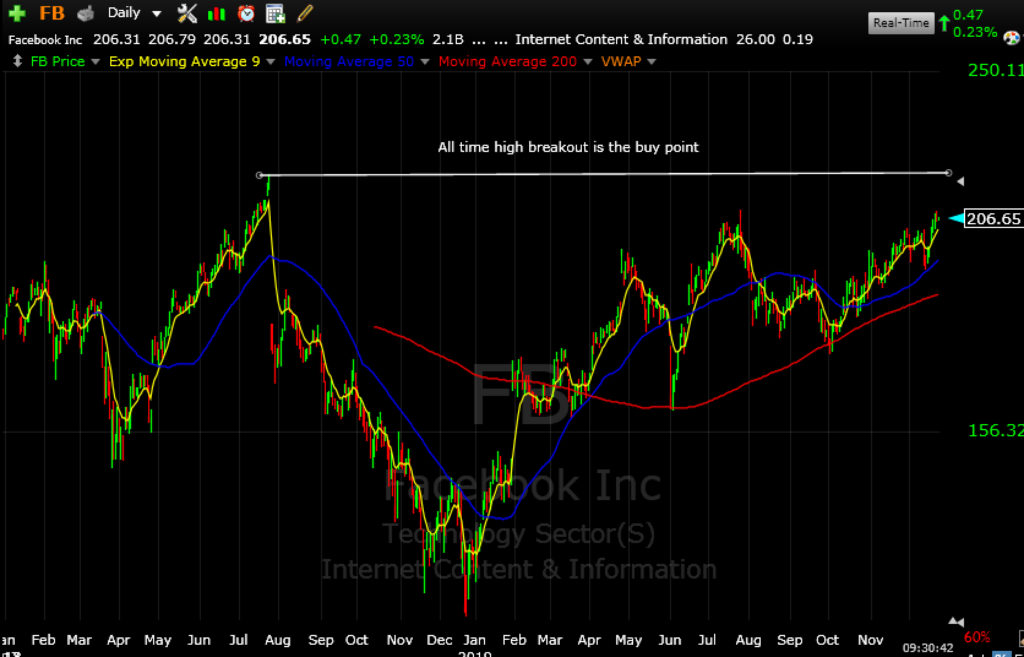
The Facebook setup is so simple it takes only 5 words: break the all time high. The stock made an all-time high in July and has been pulling back on a plethora of concerns since. It’s now inching back up to highs and is ripe for a big breakout.
The Google setup is just as simple as Facebook’s: buy the dip. We can think of GOOGL pattern as the future of Facebook, since it recently broke its all time high earlier this month after a big pullback. It could be starting a new trend, which makes it rip for continuation pullback setups.

The Netflix buy point is at $362.50. This is where the stock was prior to it’s big July gap down. If it recaptures this level it basically invalidates all the bad news it’s accumulated since that day.

Finally we have Amazon. The retail giant has had a lack luster 2019. More important for us technically, it is under it’s 200 day moving average. This is a bearish indication. So does this mean we stay away from the stock? We stay away for now. However, if it remounts the 200 day ma, and we see a spike in positive green volume that indicates institutional buying interest, the stock is back on trend. This offers a low risk, high reward setup.

Conclusion
Nobody knows the future or can accurately predict what will happen in 2020. While there is no certainty in terms of where price will go for FAANG stocks, we can be sure that there will be plenty of volatility and opportunity.
Each FAANG chart is setting up for a potential monster trade. Have a plan, adjust to new market conditions, and pounce when the one big trade presents itself.
Swing Trade Service
This swing trading service is great for those that work and can’t monitor the computer all day. We have in-depth nightly reports on the gameplan for the day/week and all stock picks that I trade will be alerted and emailed to you.