Every new trader is obsessed with indicators. They think there is some magical indicator out there that they can slap on their chart that will instantly turn their computer into an ATM machine.
Unfortunately, this is a pipe dream sold by many trading gurus. There is no special indicator you are missing that will change the game for you immediately. Indicators are useful, but they are not the sole ticket to your success.
No matter what line or dots you add to your chart, there are limitations to them. You have to know how to piece together a system and what indicators to specifically add to complement your system. Sure, they can help you with certain parts of your game, but you cannot rely on them solely to base your decisions.
Trading Indicators Lag
Whatever period you set them on, that is how long it takes to calculate a new value. For example, a 9MA (moving average) on the daily chart won’t move and solidify itself until the next day closes. Price action and technical analysis are real-time and dynamic. You can see exactly what is going on right now, right here, and can make informed real-time decisions based upon the data you are seeing now.
There Are Infinite Combinations
If everyone looks at the same chart of $QQQ on a daily, no matter what, everyone will see the same exact resistance level and will look to play off of that, and will take that level into account. It doesn’t matter if they have MACD on their charts, RSI, VWAP, etc. That resistance level is there and it isn’t going away.
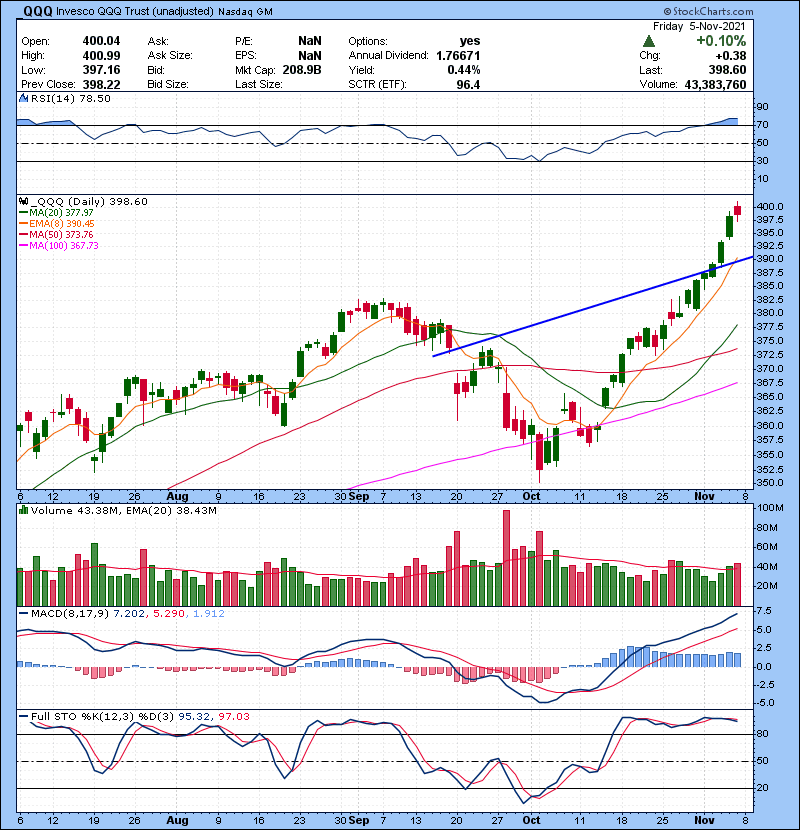
The key support and resistance levels on charts are there for everyone to see and use. While the price action and technical analysis are the same for everyone, the indicator combinations people can put on their charts are far from it.
How many indicators are there?
Maybe 700? 900? 3000?
The combinations of indicators and the ability to code your own make the numbers astronomical.
That is a problem right? Your indicators are telling you one thing while the next trader sees something different based on their indicators.
The world watches and can identify simple technical analysis patterns and price action with ease, and it is by default on everyone’s charts. Follow that concept, and add a few indicators to your chart that just help guide you.
When To Use Trading Indicators
The best way to use indicators is to compliment your already existing knowledge base of technical analysis, and to compliment your current system. Utilizing indicators like moving averages for example are a great tool to help you trail trades and stay in them longer, and also identify a trend to risk off of.
Check out this diagram below as an example:
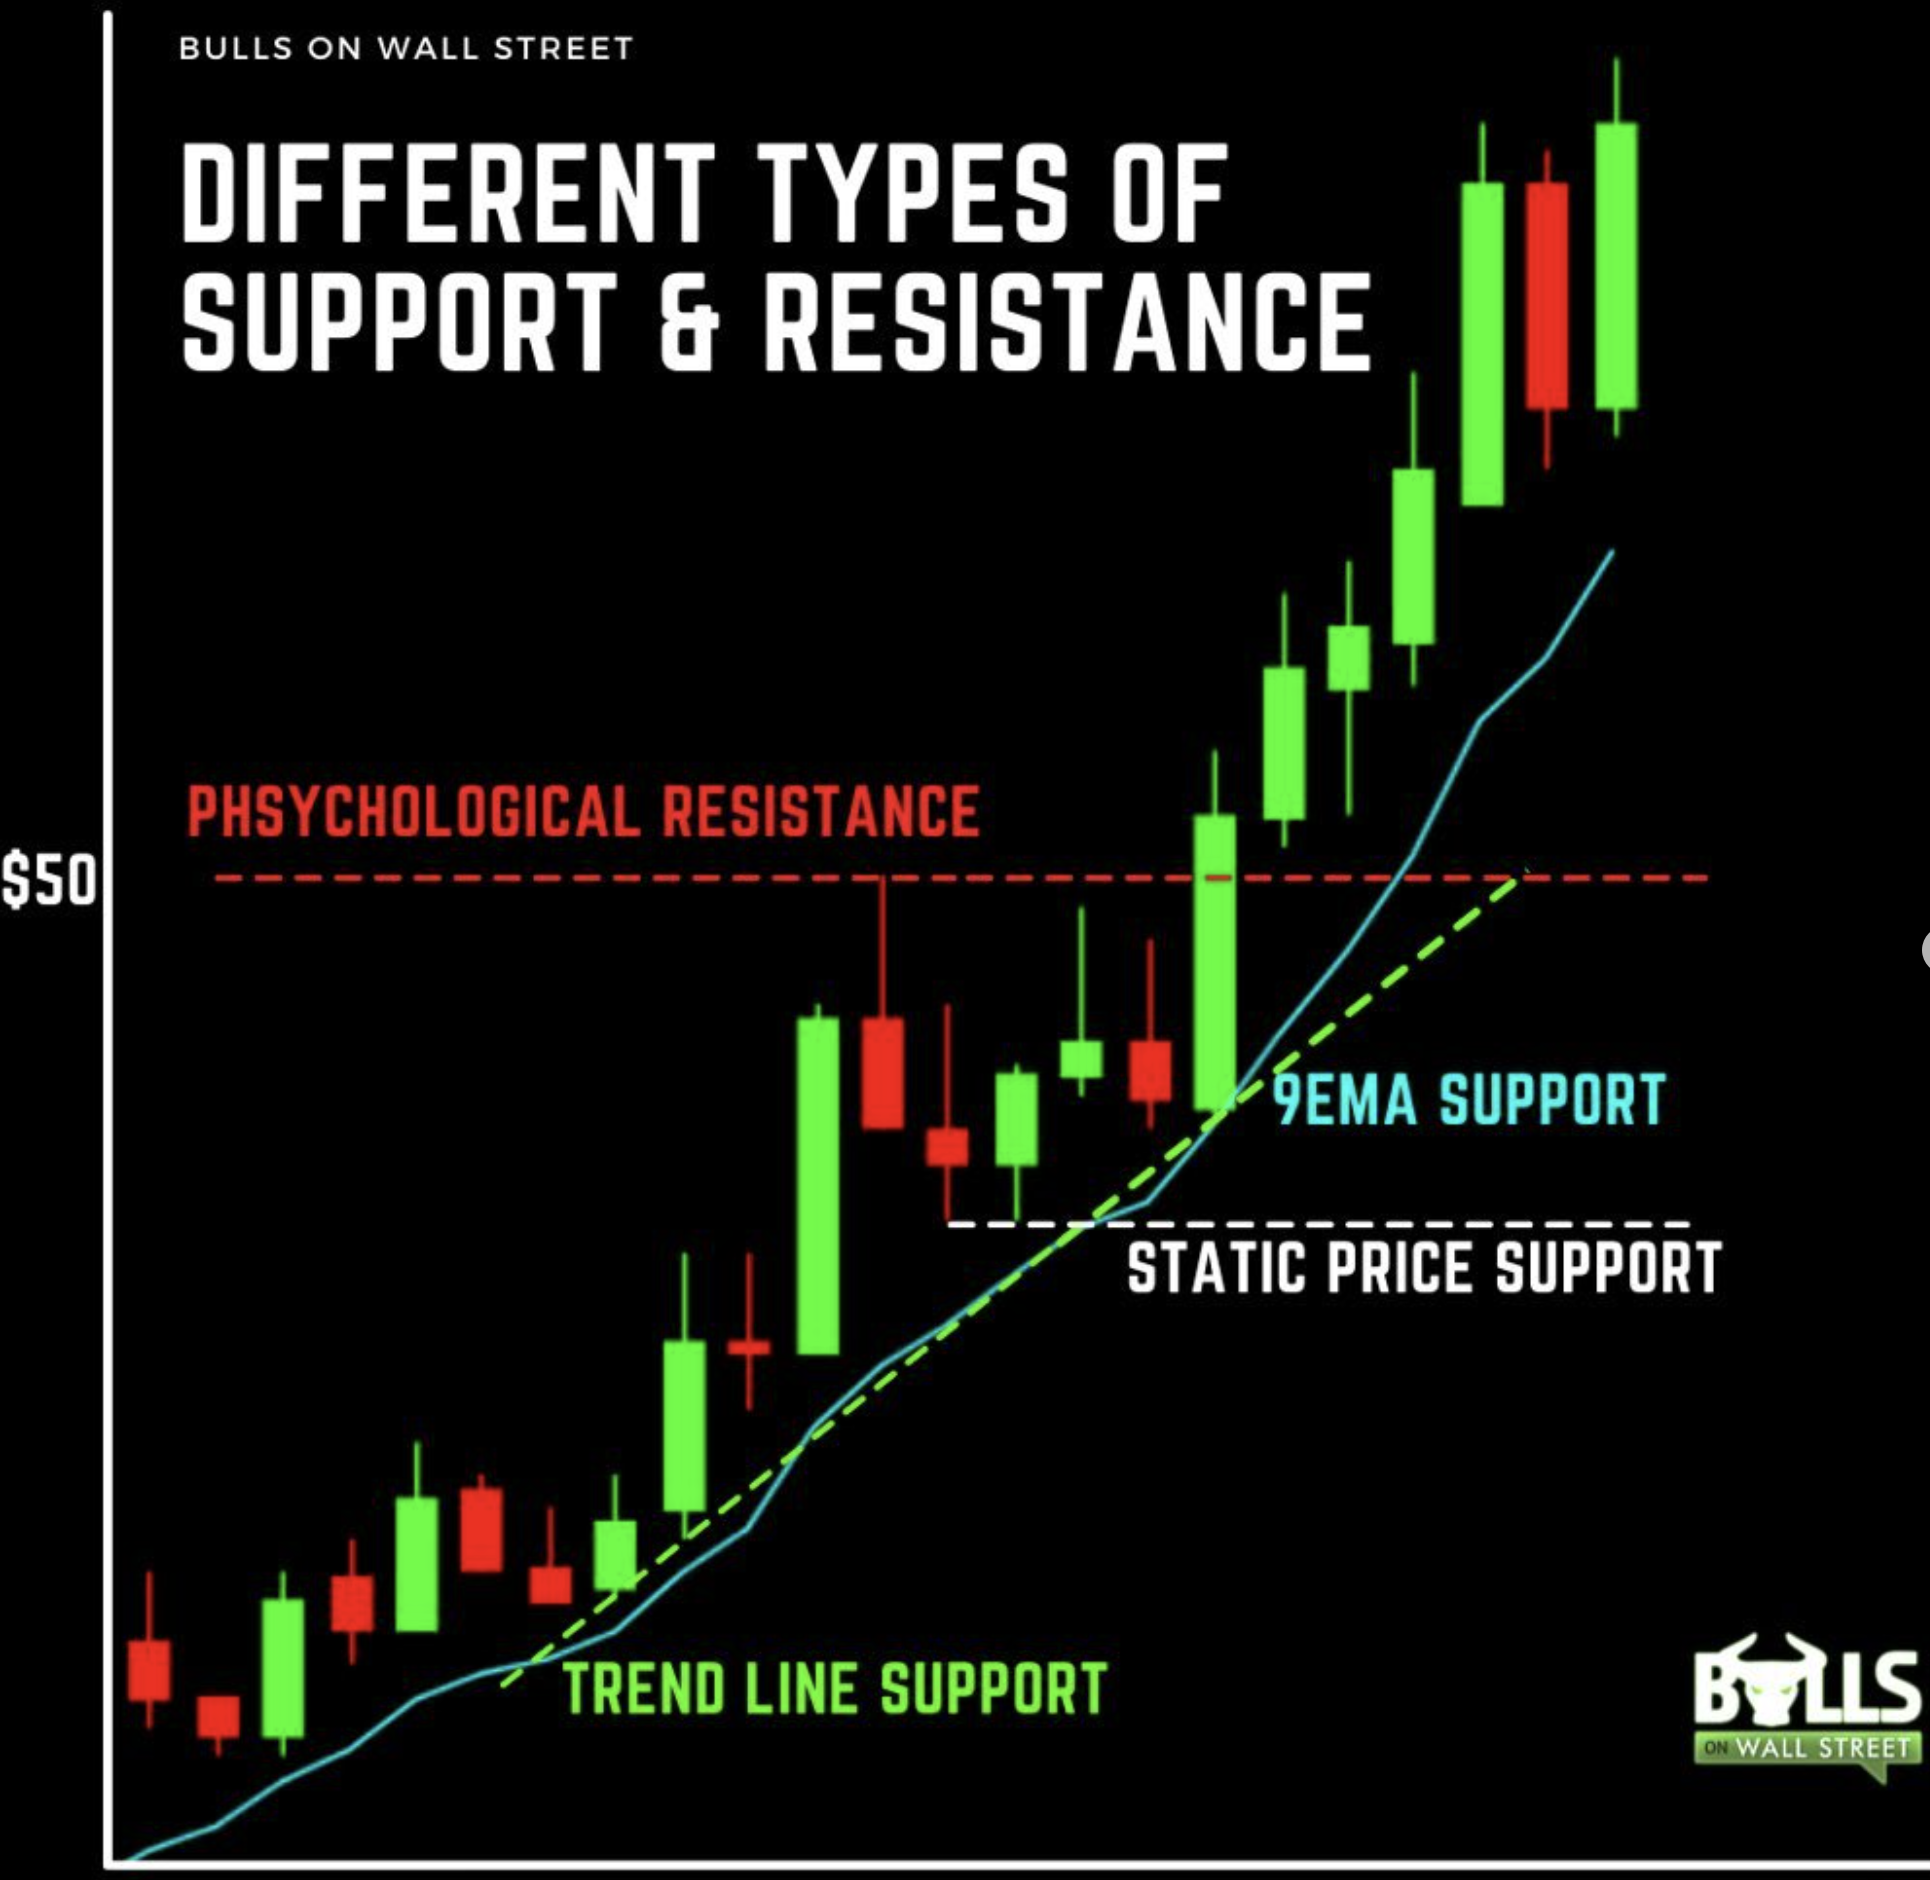
The resistance zone and hard trend line are both used to time your entries, but as the stock continues to move higher, you can use something like a moving average to ‘hug’ the price action more and give you a more dynamic trailer to your trade. That is what we like to use moving averages for, trailers and trend indicators on trades where normal support, resistance, or trend line support levels may be too far off the current price.
Think about what type of trader you are, and try to experiment with different indicators that may compliment your game. You want to add something that will do some of these things:
- Keep You In Trades Longer
- Be a Trailing Stop When Stocks Go Parabolic
- Identify Trend Support and Resistance
- Visually Identify Supply & Demand Imbalances
VWAP, RSI, and MACD for example help to identify supply and demand imbalances and who is in control in their own ways. Moving averages like shown above help to keep you in trades longer and can show some key support and resistance levels.
While no stand-alone indicator will be the “fix-all” for you, adding some to your game to help the areas above will help you in the long run.
What To Focus On
Technical Analysis and Price Action. Real traders know how to use simple technical analysis that has been around since charts were invented. Technical analysis concepts like support and resistance, channels, flags, etc. hold true because they are an exhibition of natural human emotion and supply/demand imbalances in the market. You can’t fight those mechanics that make stocks move. Supply and demand, as well as volume and price action, make stocks move, and they always will.
When you take a trade, you have to consider all the factors at play, not just the indicators. They are a piece of the puzzle, but not the only piece.
Adding indicators on your charts like EMAs, VWAP, and Volume Forecasts can help you see where the trends are, and who is in control (buyers or sellers), but ultimately, they don’t replace your knowledge of technical analysis to gauge what the stock will do next, or show you the whole picture.
Conclusion
As a new trader, there are certain things you should focus on, and certain things you shouldn’t be. Plain and simple.
We recently dropped a YouTube video where Kunal covers the top 6 questions new traders need to answer and understand immediately to be successful from the get-go. Check it out below, this is a great compliment to this knowledge:
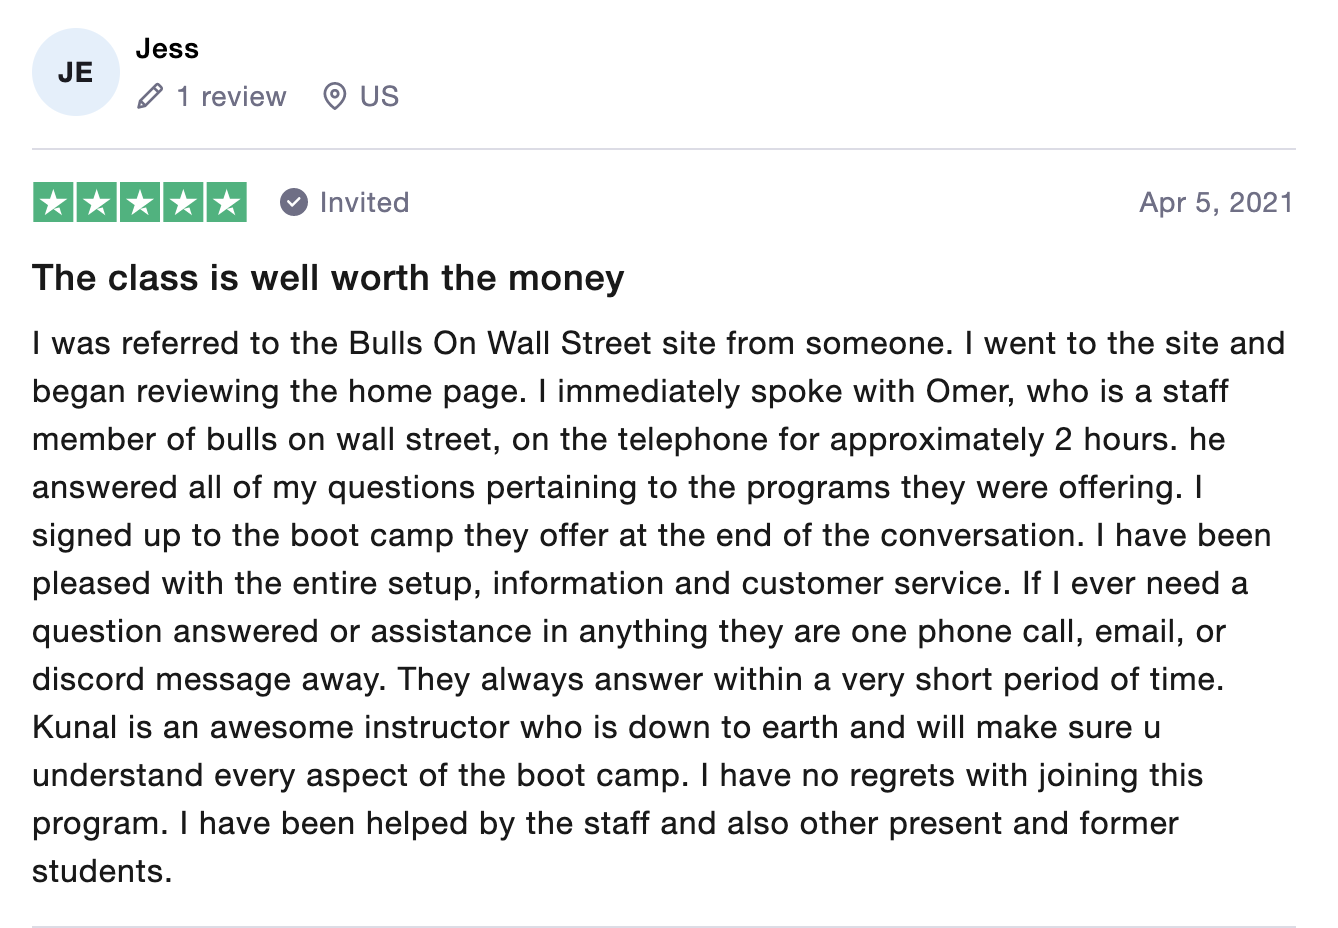
Just take it from Jess here, a student who took the time to learn things properly, didn’t ‘system-hop’ looking for the perfect indicator, and put the work in.
Live Trading Classes From Experienced Traders: Join Our Live Trading Boot Camp
Space fills up fast in our boot camps. Apply for your seat to see if you qualify!
