New traders have an obsessive preoccupation with trading indicators. Everyone wants know:
What trading indicators do you use? Once I use them I will become profitable?
There is a major misconception behind this question that should be addressed: It’s not the indicators you choose that determine the profitability of the trader. It’s HOW they are used.
Today’s blog will talk about how to build a winning trading mindset that allows you to get the most out of trading indicators. We also list all of the common trading indicators so you’re familiar with them if you’re brand new!
Let’s dive in:
Understand The Role of Trading Indicators
There are thousands of profitable trading strategies out there using almost every trading indicator you can think of. So why isn’t everyone a successful trader or investor?
The truth is the trader makes the strategy, the strategy doesn’t make the trader. Finding your strategy is a small, and relatively straightforward part of the trading journey.
The gap between the trading consistency you seek and where you are now is not your strategy. It is your belief systems & mindset that determine your ability to execute a strategy successfully.
We dive into more of the psychology of how to use trading indicators in our upcoming trading psychology course, taught by Kunal Desai and Agnieszka Wood to help you build a bulletproof mindset to dominate the challenging 2022 market conditions! She is an experienced trader with over 20 years of experience as a life coach and NLP Practitioner, and a former boot camp student of Bulls on Wall Street!
This video will will help you understand why your trading indicators may be failing you:
Click Here to Enroll in the course if you interested in the course!
Now that you understand the mindset behind using indicators successfully, let’s check out a list of the most common indicators traders use in the current era:
Moving Averages (Simple & Exponential)
There are two types of moving averages to be aware of: Simple Moving Averages (SMAs) and Exponential Moving Averages (EMAs)
Both types of moving averages have their pros and cons, and work better in different scenarios. The main thing you need to understand though are their differences in how they are calculated and how they look visually on your charts so you can incorporate them properly.
Simple Moving Average
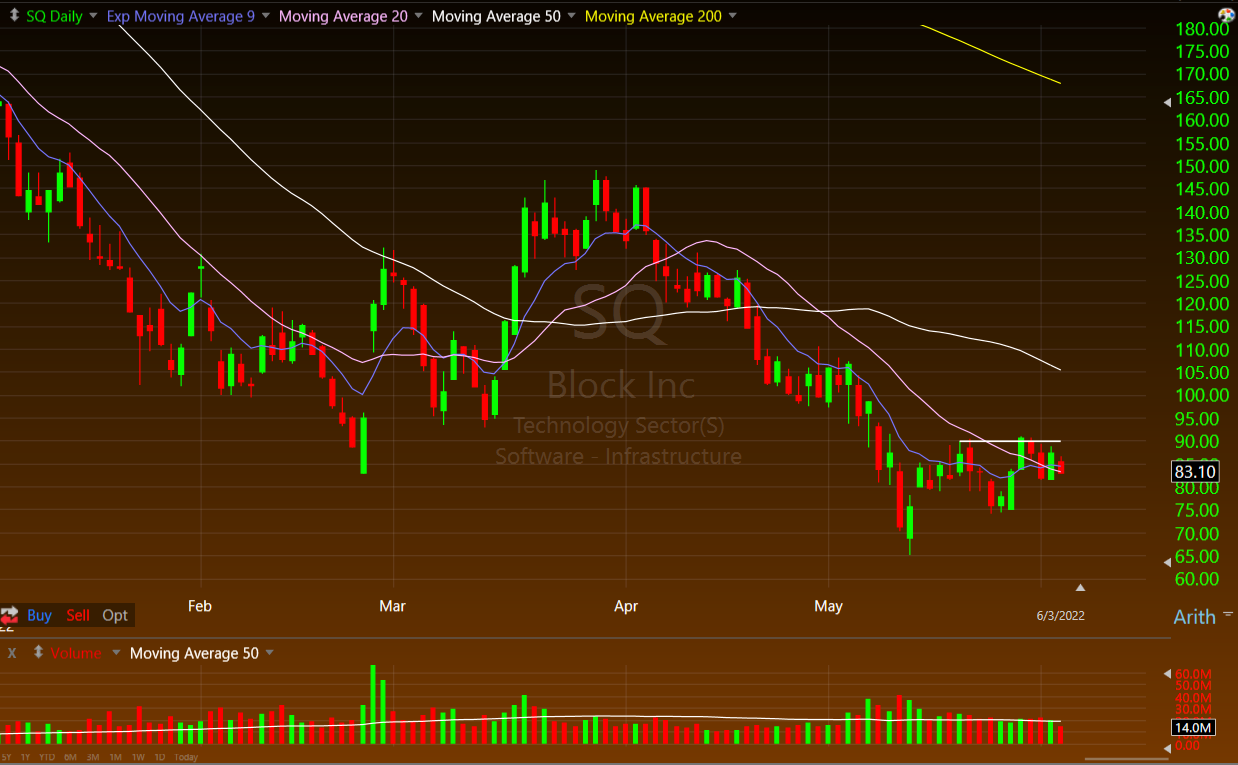
Simple moving averages are very straightforward. SMAs take recent closing price data of ‘x’ number of prior closes and averages them together. For example, a 10 day SMA is the past rolling 10 days closing prices averages together and plotted on a chart. In the chart above you can see the 20,50, and 200 SMA’s plotted.
Exponential Moving Average
Exponential Moving Averages as well tend to ‘hug’ the price action of a stock more and update quicker than Simple Moving Averages which tend to lag. In the chart above, you can see the purple 9 EMA.
How To Use Moving Averages
Usually, we use SMAs on longer term time frames like the weekly, monthly, and daily charts, and EMAs on shorter intraday charts like 5, 10, and 20 minute charts
If a stock is above a moving average, it is considered bullish. If it is below a moving average, it is considered bearish. Now, the longer the moving average is (meaning the higher the input), the stronger it will be
Many traders also trade EMA and SMA crosses, meaning when two moving averages cross to the upside or downside, that is considered a bullish or bearish move to them. Also, if the price closes above or below a certain moving average the trader watches, they could also consider that to be bearish or bullish on that respective time frame.
There are many ways to trade around moving averages, but always remember, they are not perfect. Use them as guides to quickly determine the trend the stock is in.
Bollinger Bands
Bollinger Bands are tools that are defined is a technical by a set of trendlines continuously plotted two standard deviations (positively/above the price and negatively/below the price) away from a simple moving average (SMA) of a stock’s price in the middle of the upper and lower band.
These were developed and copyrighted by a famous technical trader named John Bollinger, and he designed them to help traders visually see if a stock is oversold or overbought.
How to Use Bollinger Bands
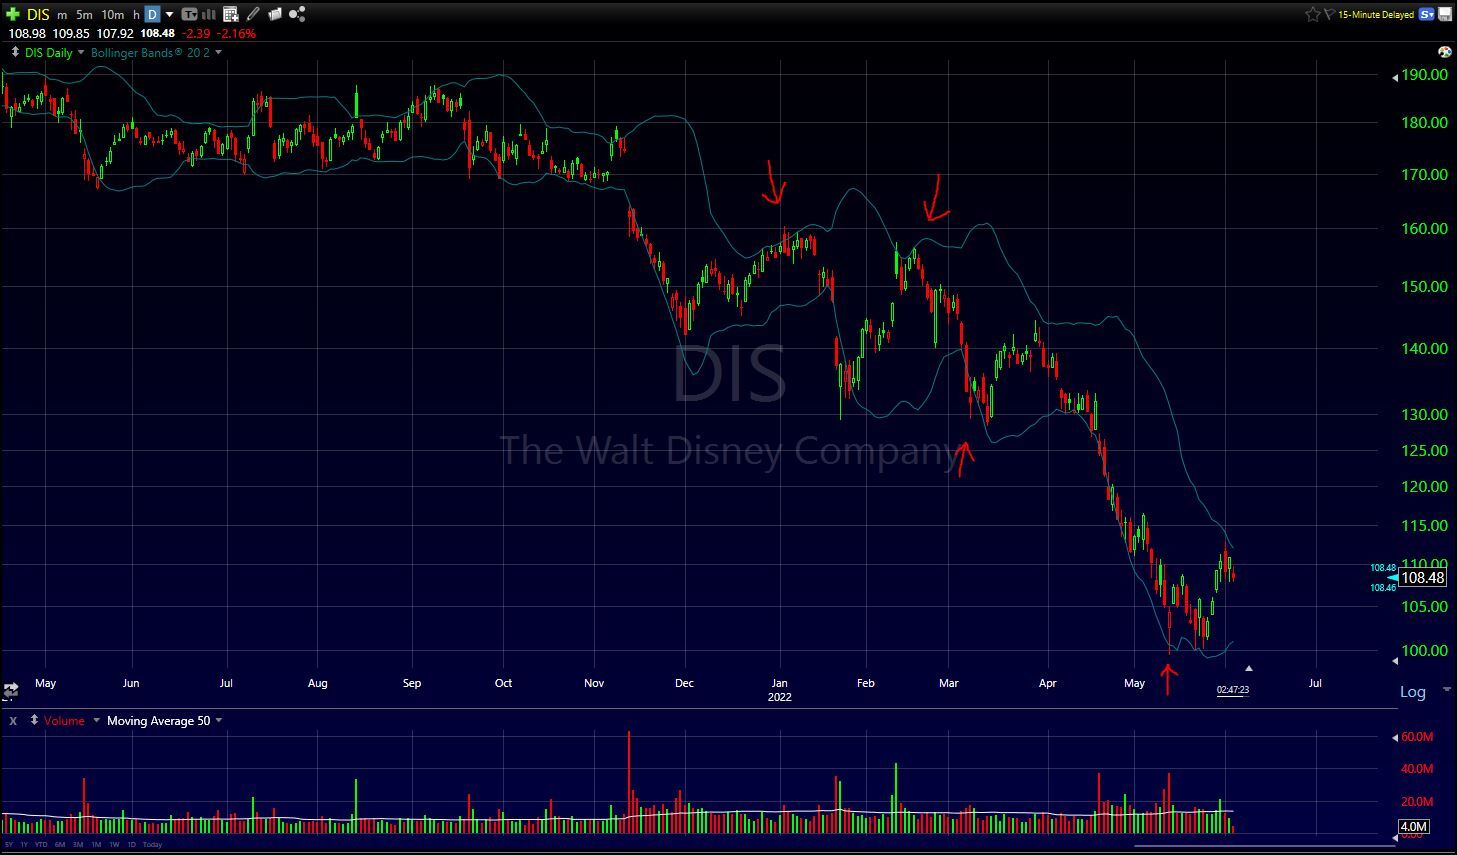
If a stock is reaching the upper end of the bollinger band, it is starting to be considered overbought, so looking for short opportunities is good there or selling some of your existing long position is smart.
If a stock is reaching the lower end of the bollinger band, it is starting to be considered oversold, so looking for long opportunities is good there or covering some of your existing short position is smart.
Relative Strength Index (RSI)
The relative strength index is a momentum indicator that basically measures the magnitude of recent price changes to evaluate if the stock is now overbought or oversold. It looks at the pace or speed of recent price changes up or down to determine whether a stock is ready for a rally or a selloff.
How to Use RSI
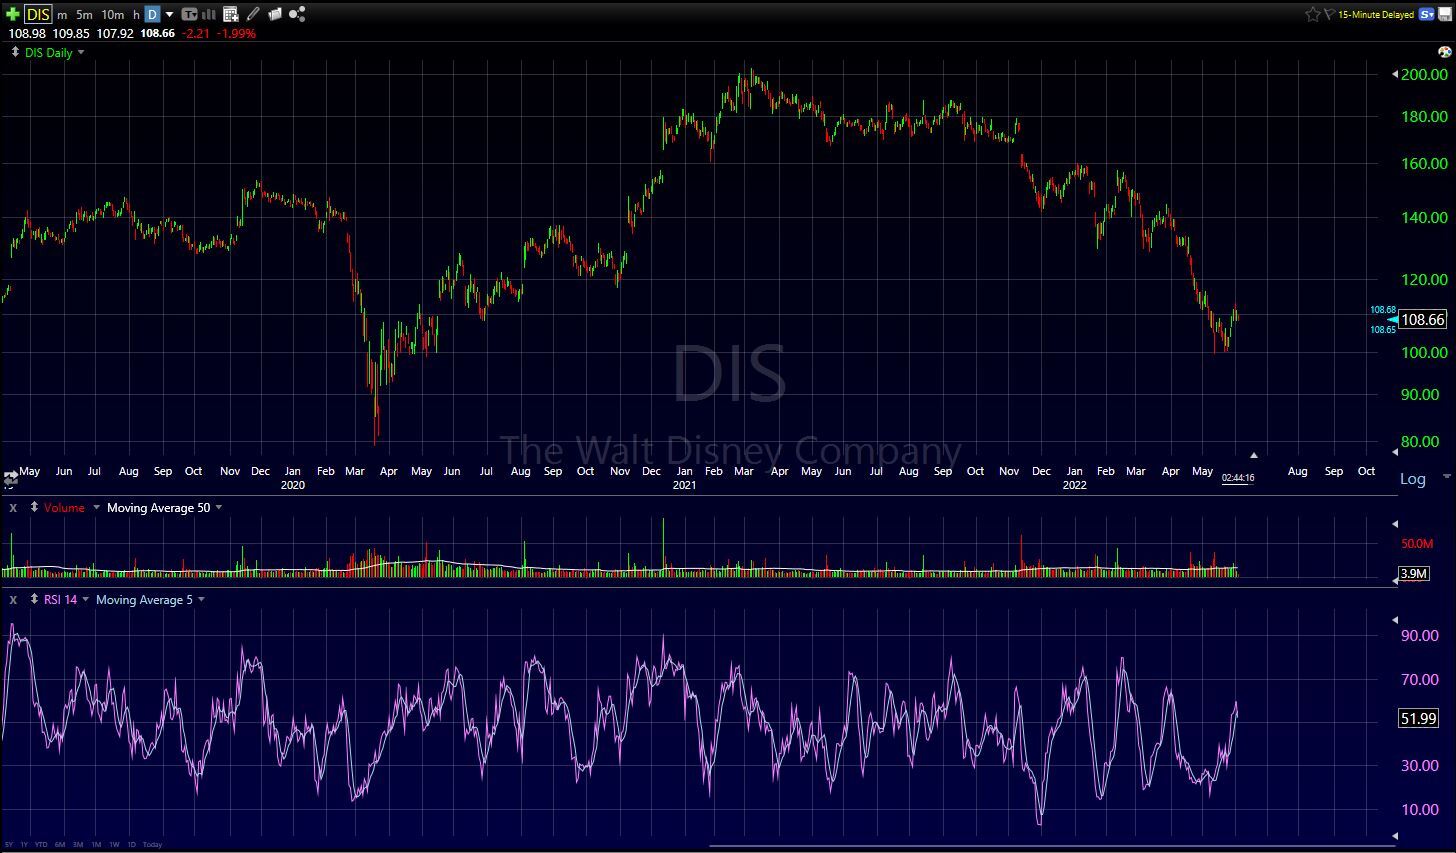
Using RSI is pretty simple. When the RSI surpasses the horizontal 30 reference level, it is a bullish sign. When it moves below the horizontal 70 reference level, it is a bearish sign. Traders will look to time short entries when the RSI is well above the upper 70 level, and long entries below the lower 30 level.
Moving Average Convergence Divergence (MACD)
MACD is a more ‘fancy’ sounding momentum following indicator that basically shows the relationship between two seperate moving averages. Standard MACDs are calculated by subtracting the 26-period EMA from the 12-period EMA. You can always adjust the settings of your own MACD of course, but just know that traders use MACD to identify when bullish or bearish momentum is high in order to spot entry and exit points for trades and continuation patterns.
How does MACD work?
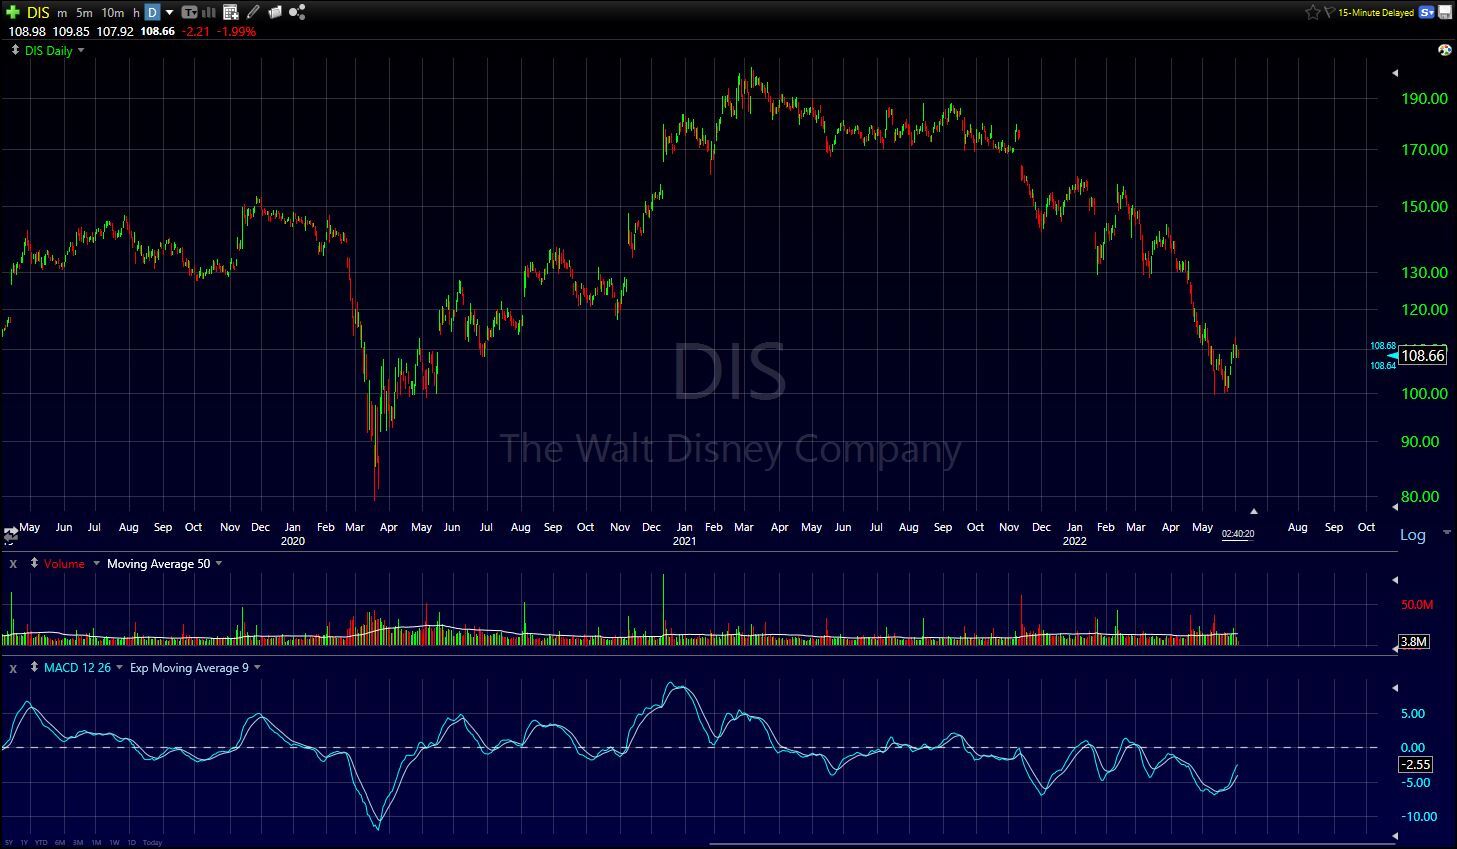
When the MACD like in this chart example above crosses above zero, it is considered bullish at that time. When it crosses below zero, it is considered bearish at that time. When MACD turns up from below zero to above zero, that move is considered bullish and the stock is strong. Conversely, when MACD crosses from above zero to below zero territory, the stock is considered bearish and the stock is weak.
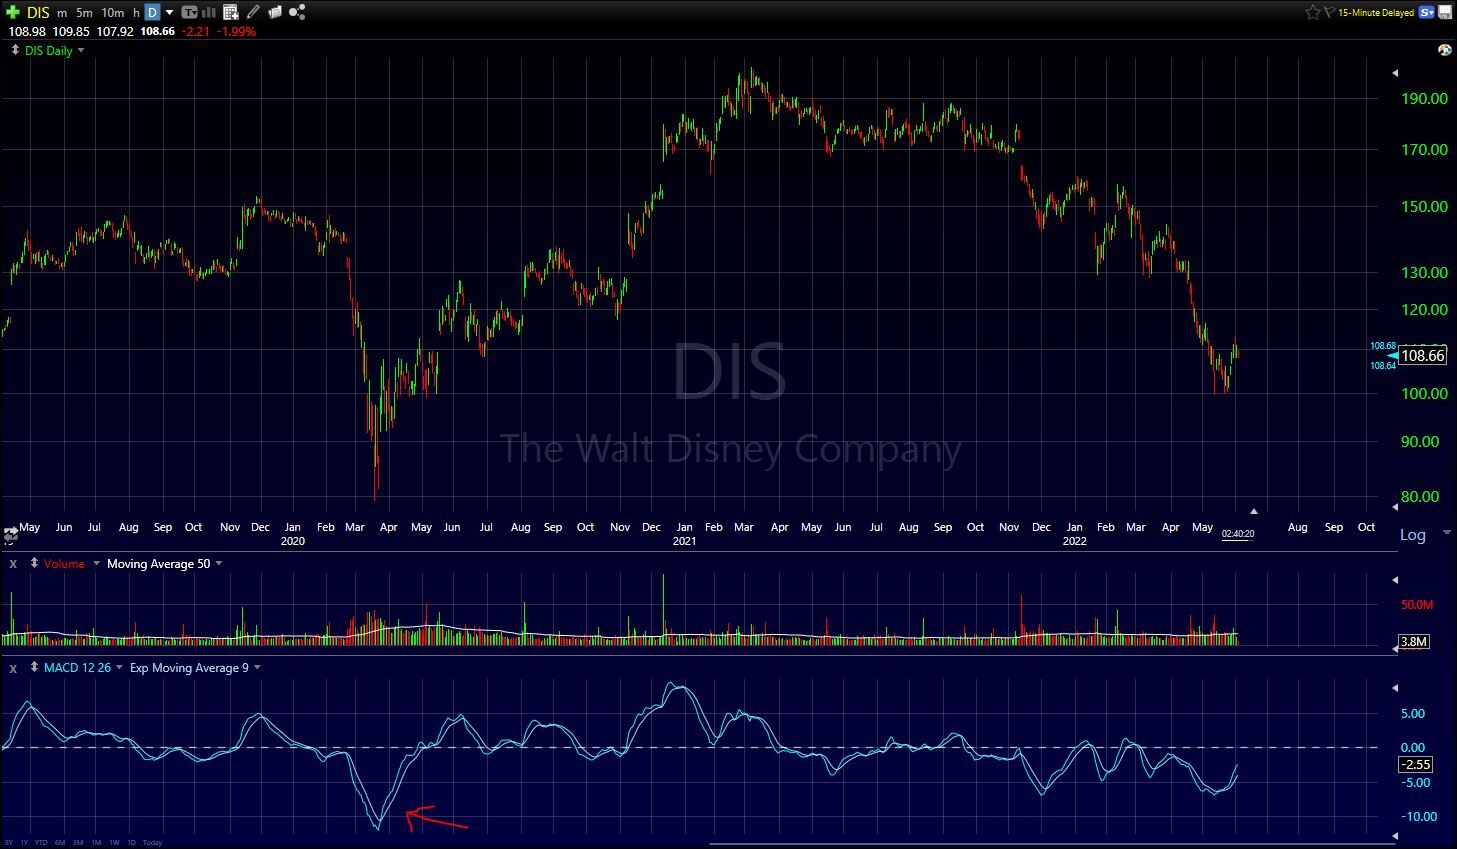
Also to note in this example above, you see that where the MACD is plotted, there is also a 9 EMA. Whenever the MACD line (the darker blue) crosses from below to above the shorter-term 9 EMA line, that is considered bullish. The further below as well the zero line this occurs, the stronger the potential upside move is. You should look for entries when this is occurring to the long side, and vice versa for the short side. The arrow on this chart above shows the exact point where we are talking about where the MACD line crosses above the 9 EMA it is paired with.
Now that you have a basic understanding of indicators, you are ready to start learning how to build a winning mindset to use them correctly with strategy. That is the goal of our upcoming trading psychology course:
Join Our Brand New Trading Psychology Course!