I have mentioned before that when you are new to trading you should find a handful of setups that you know how to trade and master those. I have mentioned several times that the parabolic short and bull flag were always my top 2 go to setups. Well another one that I trade quite often and is easy.. is charts just like LPX.
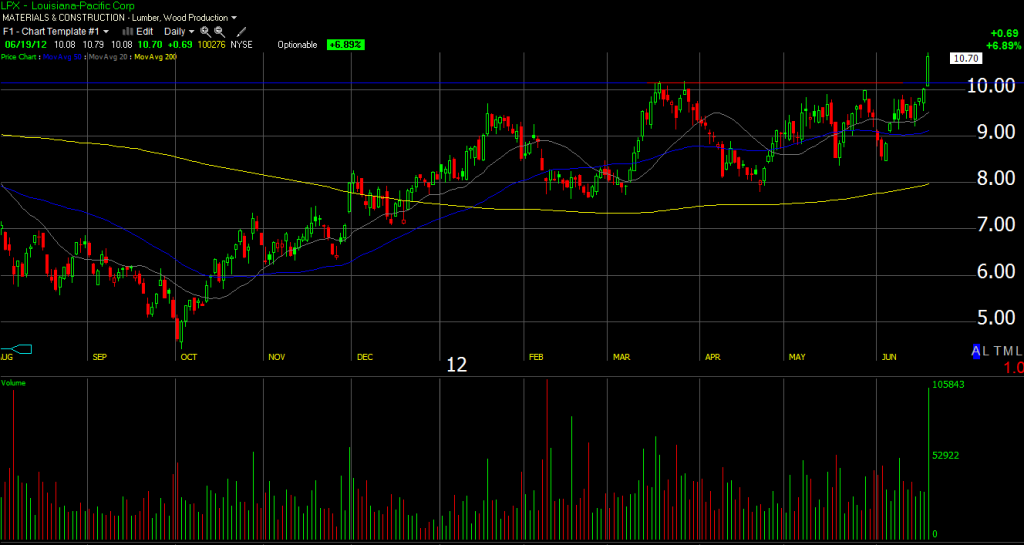
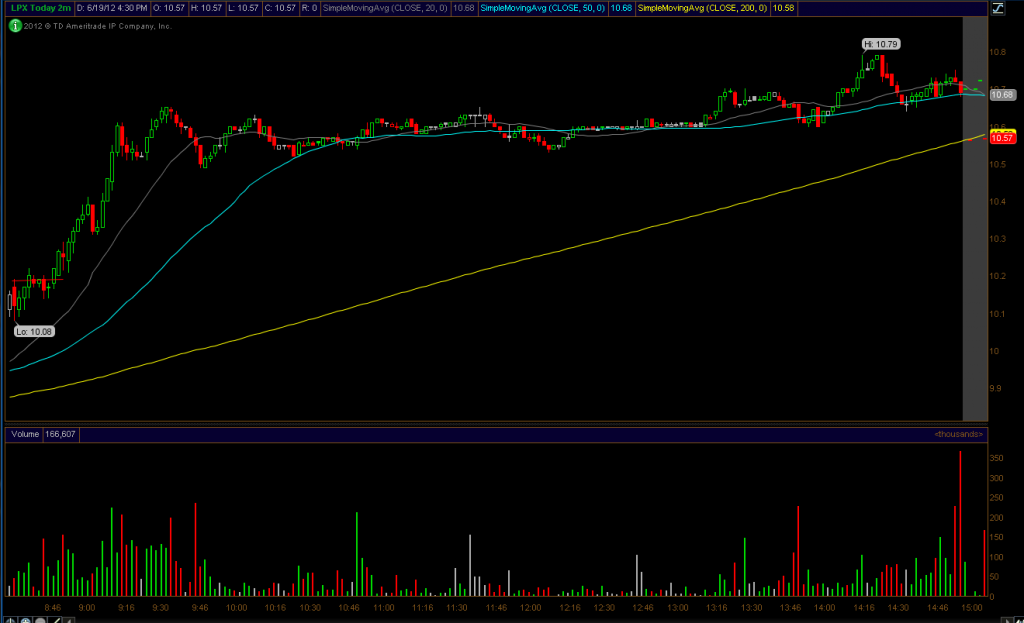
today we traded LPX for a nice $240 profit. I had been watching LPX for weeks because the chart was so great. It was even on the watchlist last night. It was inevitable that the thing would breakout sooner or later.. Well today we got that breakout. The more times a stock taps a level, the more powerful the breakout is gonna be when that level finally breaks. Each tap is absorbing sellers. If you look at LPX, you will see that it had previously tapped that 10.18 level 2 other times and failed. So this time when 10.18 started to break, I knew that today would be the day the stock would run. We bought the stock at 10.18 and watched it rocket all day finally closing at 10.7. The volume typically comes in after the breakout. When you see the volume coming in, thats your confirmation that the trade is going to work. The reason why this are so simple is because its easy to figure out if the trade is working for you or not. And if it fails.. you simple sell the stock for a small loss
take a look at the lpx chart both intraday and daily..


