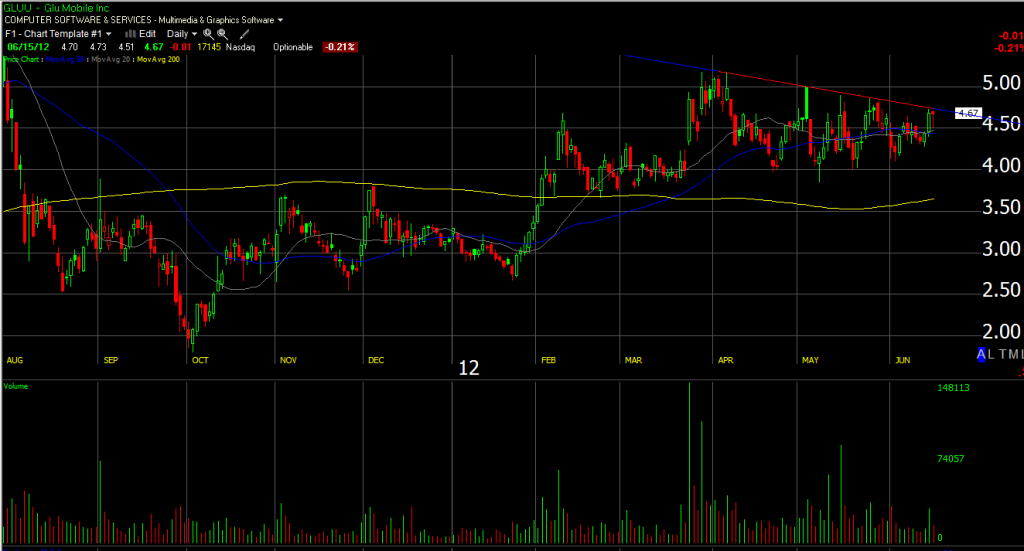
Today we bought GLUU in the boom room on a breakout. The GLUU chart was a classic diagonal price break of resistance. Often you see traders draw horizontal support and resistance lines.. but remember there is also diagonal support and resistance occuring on alot of charts. You have to train your eye to be able to spot both. Gluu was a nice trade as we had a perfect entry on the chart..I sold 1/2 of it very well, however I sold the other 1/2 ver poorly.. Here is a look at what I did right and what i did wrong on this trade! Always good to learn from your mistakes 🙂
GLUU- had horizontal price resistance somewhere around 4.7 area.. as seen on the chart below and was on our watchlist last night.
We have been talking about aligning breakouts out on multiple timeframes.. well GLUU was nothing more than just that.
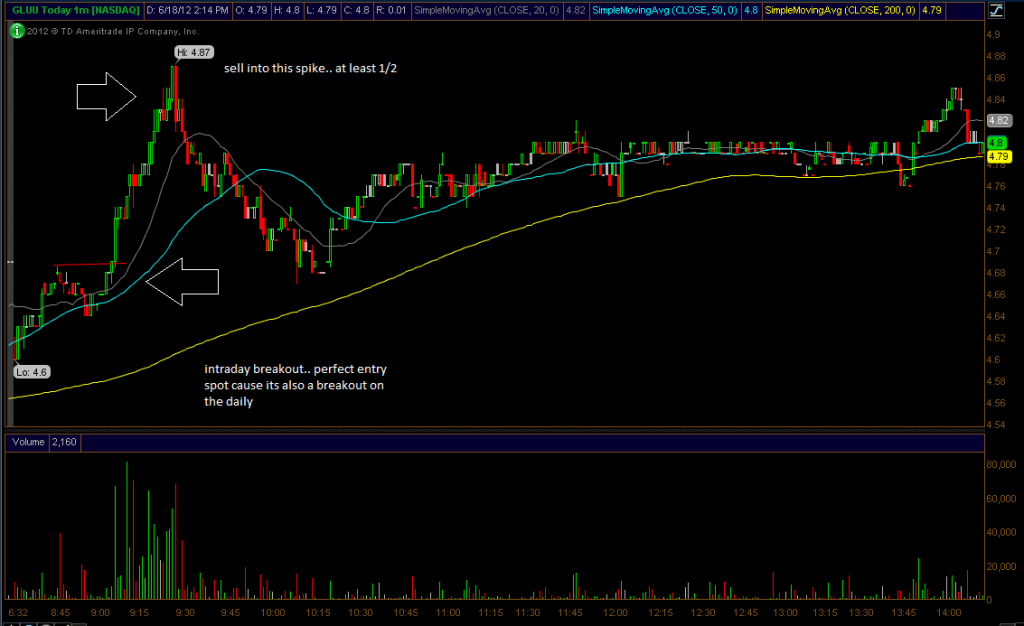
We bought the stock as it was breaking intraday at 4.68.. which essentially was also a breakout on the daily chart (4.7 area). So combining the two breakouts is what caused the pop on the daily chart.
So we had a perfect entry and a perfect sell on 1/2 our position.. but the other 1/2 is where I screwed up…
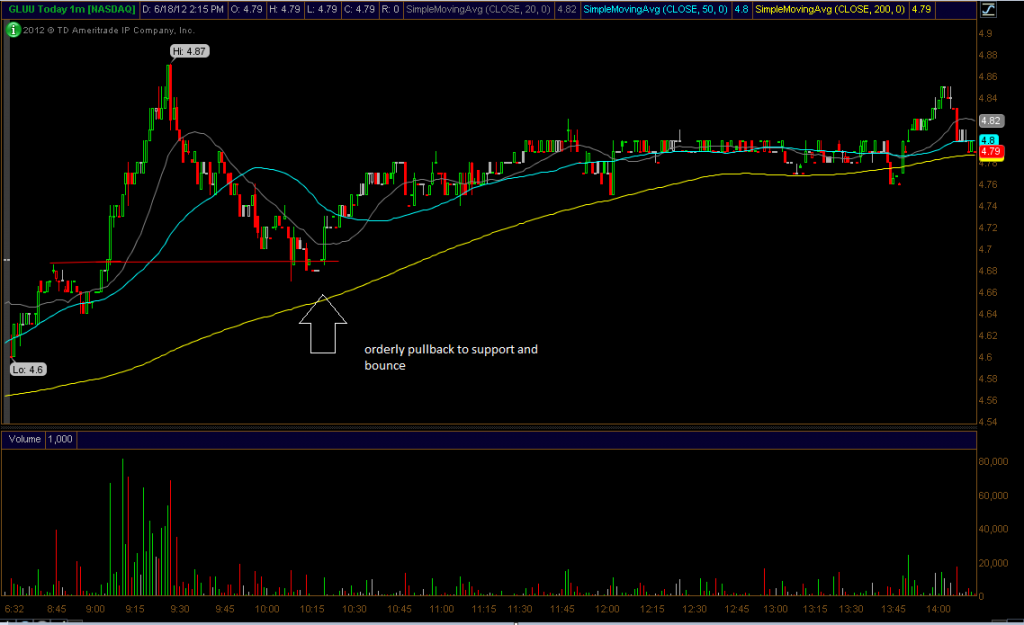
Typically after I sell 1/2 of a position I like to place my stop at my buy price to ensure that I get a gain on the stock and don’t give back the gains I already locked in. Well I stuck to the rule on GLUU (which was fine) but actually sold it exactly at the bounce spot on the intraday chart. Anytime a stock breaks a big area of resistance, that resistance then becomes support. So when GLUU pulled back to the breakout spot.. it did just that.. bounced off support. Take a look..
We still made $140 bucks on the trade.. so don’t have much to complain about.


