On Friday, we caught $DANG for a nice $340 profit. Although I sold too early, I wanted to review the trade and why it worked.
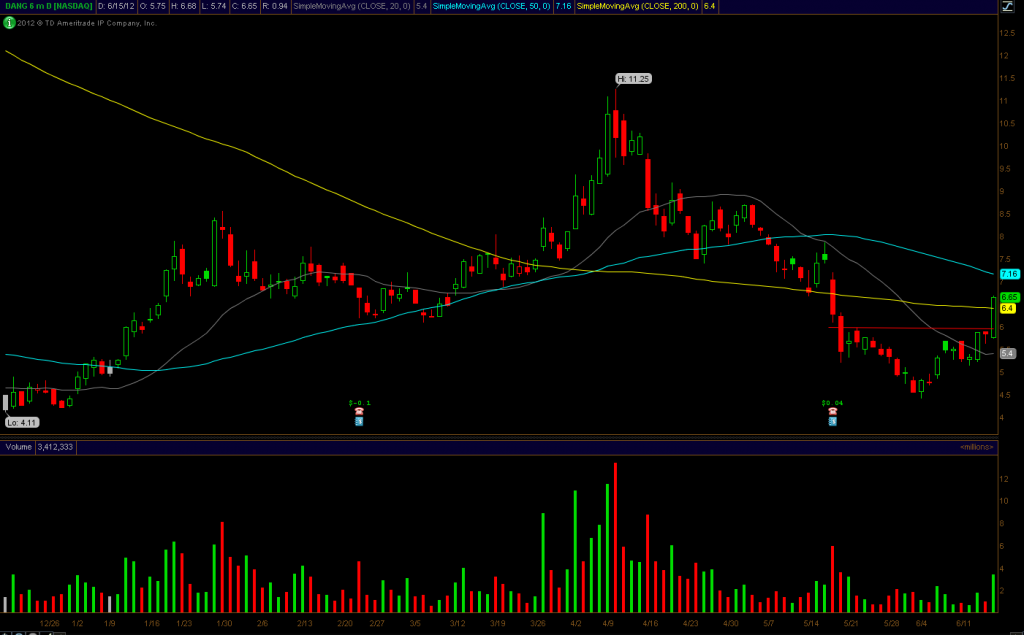
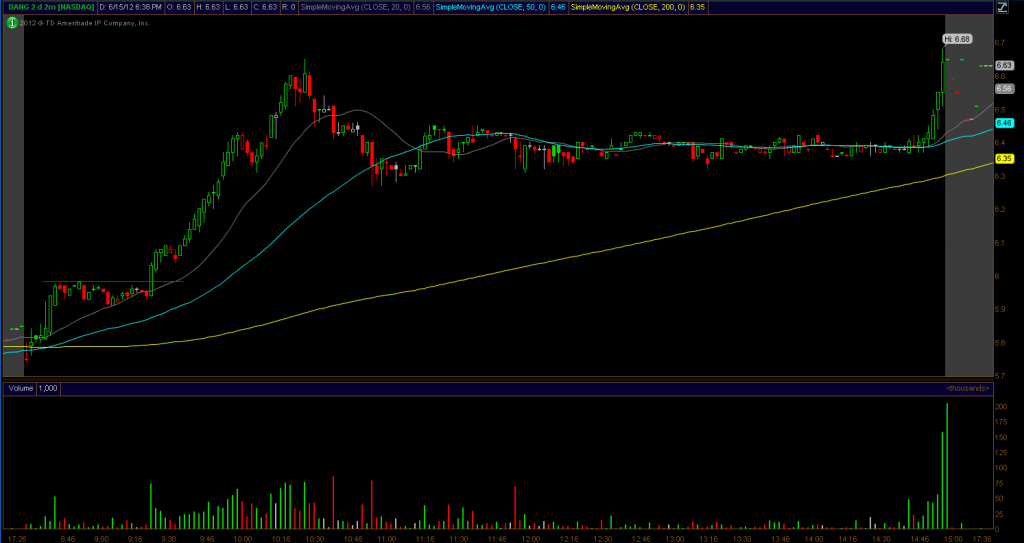
$DANG was on a lot of people’s radars going into Friday’s open because the chart was so perfect. It closed on Thursday right at the breakout spot. While it’s really easy to find great charts, knowing how to trade them and where to buy them is where the actual skill comes in. If you want to make money you have to be able to trade the charts rather than just pick them, right? Being able to trade multiple time frames is usually what separates good traders from great traders. A stock that is breaking on multiple time frames is what causes that “booom!” where you can catch the huge percentage stock movers. So here is a view of $DANG breaking on multiple time frames and an explanation of why the trade was so powerful.
We bought $DANG in the chat room at $5.98 as it was breaking on both the intraday and daily charts. Check it out.
Breakout on the daily + breakout on the intraday = powerful move
I ended up selling the stock at $6.15 and taking my $340 bucks profit simply because the market has been in “trade fast” mode for a month now. The stock actually ran straight to the 200 DMA, which I should have expected. So if you did buy the break at $5.98 and held, that 200 DMA on the daily chart would have been a perfect target for your trade. But for me, $340 bucks is a nice 10 minute gain!
To learn more, email me at kunal@bullsonwallstreet.com


