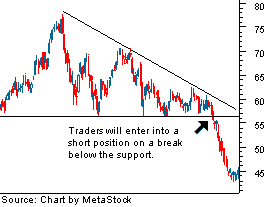
I’ve noticed a lot of my fellow bullson.ws traders have been getting burned on the descending triangle setup….
First, let’s define the bad boy – No need for me come up with my own – here is a clean and easy explanation from Investopedia:
Descending triangle
The descending triangle is the opposite of the ascending triangle in that it gives a bearish signal to chartists, suggesting that the price will trend downward upon completion of the pattern. The descending triangle is constructed with a flat support line and a downward-sloping resistance line.
Similar to the ascending triangle, this pattern is generally considered to be a continuation pattern, as it is preceded by a downward trendline. But again, it can be found in an uptrend.

Figure 3: Descending triangle
The first part of this pattern is the fall to a low that then finds a level of support, which sends the price to a high. The next move is a second test of the previous support level, which again sends the stock higher – but this time to a lower level than the previous move higher. This is repeated until the price is unable to hold the support level and falls below, resuming the downtrend.
This pattern indicates that buyers are trying to take the security higher, but continue to face resistance. After several attempts to push the stock higher, the buyers fade and the sellers overpower them, which sends the price lower.
Now let’s look at some examples of a few stocks that have caused some pain and others I’m watching:


HYTM: here is an example of a descending triangle that failed. HYTM may eventually be a big winner and run to $1.. it could happen. However, as a very short term trader, there was no reason for me to be int his stock as it tested horizontal support. It’s all about risk management.

CDII: Tricky, tricky. There are two things going on here – 1st: a weak symmetrical triangle (yellow lines). However, the stronger pattern is the horizontal support along SMA200. This makes the odds better that will act as a descending triangle, thus falling further. I do like the chart for possible breakout long, but I didn’t need to own it until it does. Then I can target 1.9 first target and established stops.


