We are going to do things a little different today. Nothing has changed with the market today. Basically everything from yesterday’s report applies today. So if you need to, re-read yesterday’s report. Today we will go over today’s trade and the new watchlist additions from the semiconductor sector.
TIBX broke down today and is removed from the watchlist.
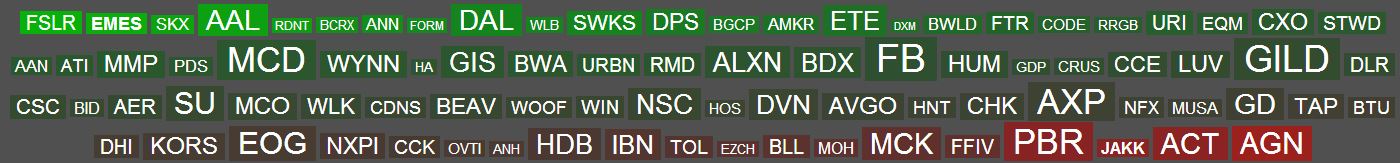
Semiconductor Sector Additions:
Yesterday we talked about how the semiconductor sector had broke out strong to new highs and it was time to add a few semis to the watchlist. There over 100 strong semi stocks to choose from. I narrowed it down by picking the semi stocks with the best volume patterns, strong price action and low float. Low float stocks don’t take much to move if there is a catalyst.
The volume patterns come in two varieties. One is a strong breakout day with low volume on pullback. The other is accumulation within a range or trend. For this you are looking for bigger up volume bars than down volume bars.
Watchlist stocks are not ready for entry yet. We watch them until they near entry level. At that point, they move to the focus list.
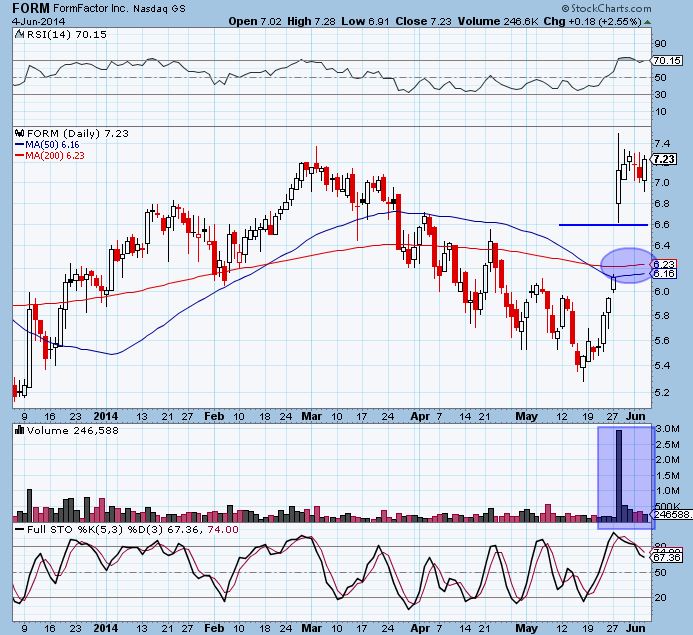
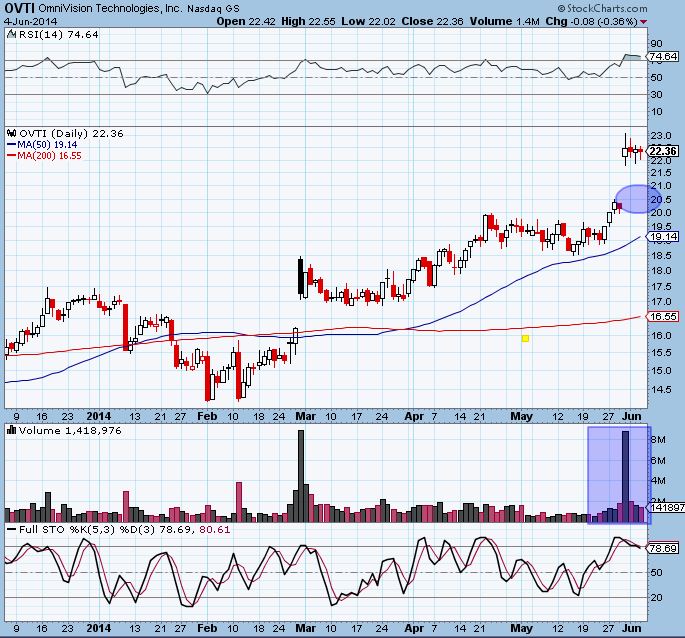
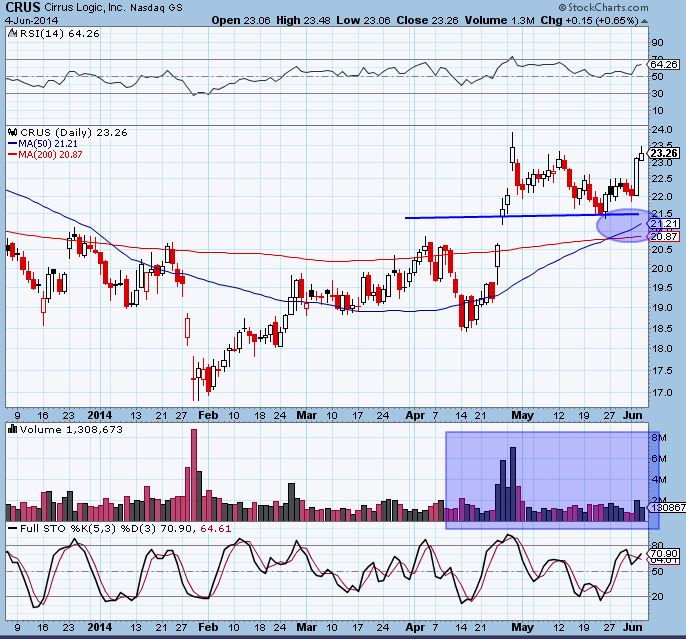
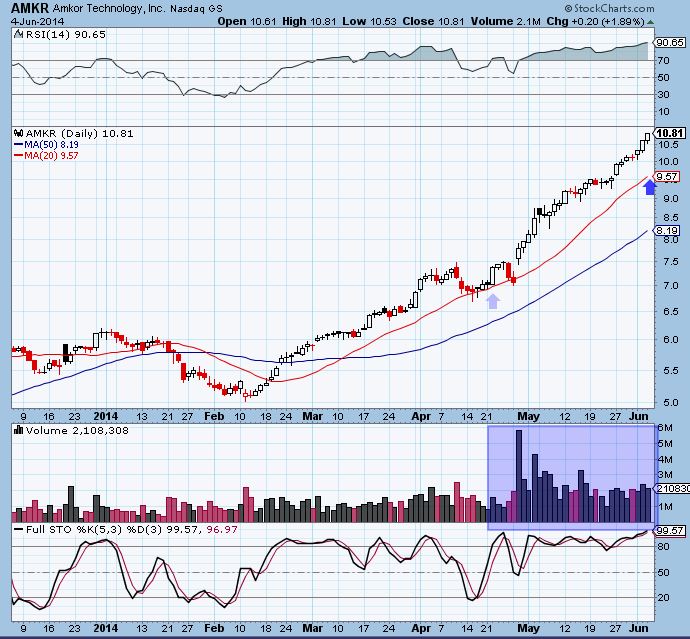
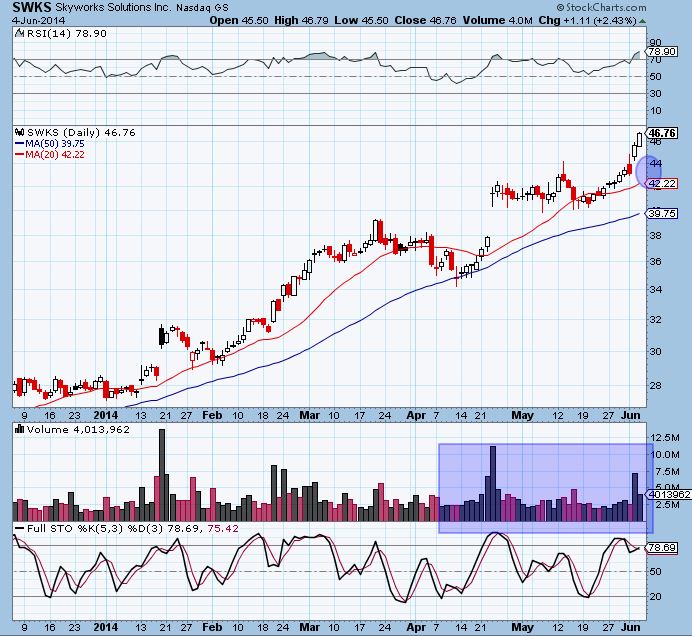
The 5 additions are FORM, OVTI, CRUS, AMKR, SWKS
FORM is a breakout pullback setup. There is no way of knowing if it pulls back to the bottom of the breakout bar at $6.60 or gapfill and ma support at $6.25. You can either wait for gap fill, or enter early if you are fine with getting stopped out and re-entering.
OVTI is similar to OVTI. Either a breakout trading range entry or gapfill.
CRUS is a good entry on pullback to bottom of breakout trading range, which also has converging moving average support.
AMKR is a trend pullback play on pullback to the 50 dma.
SWKS is another pullback entry with a great volume pattern.
New subscribers and trial members please leave me any feedback/comments in the comments, via email (singhjd1@aol.com) or twitter (twitter.com/PaulJSingh)
