Quick Summary
SPY printed a doji hammer today. Tomorrow we will know if a bearish evening doji star pattern prints. If not already short, one can enter near today’s candle tomorrow. GDP added to focus list stocks NFLX and JAKK. Looking for pullbacks for long entry. Market leaders did surprisingly well today. Money continues to poor into India ETFs.
The Market
Key Pivot Levels: 190.42: new high resistance 186.59: 50 day moving average 181.31: recent low 181-184: plenty of buying in this range. 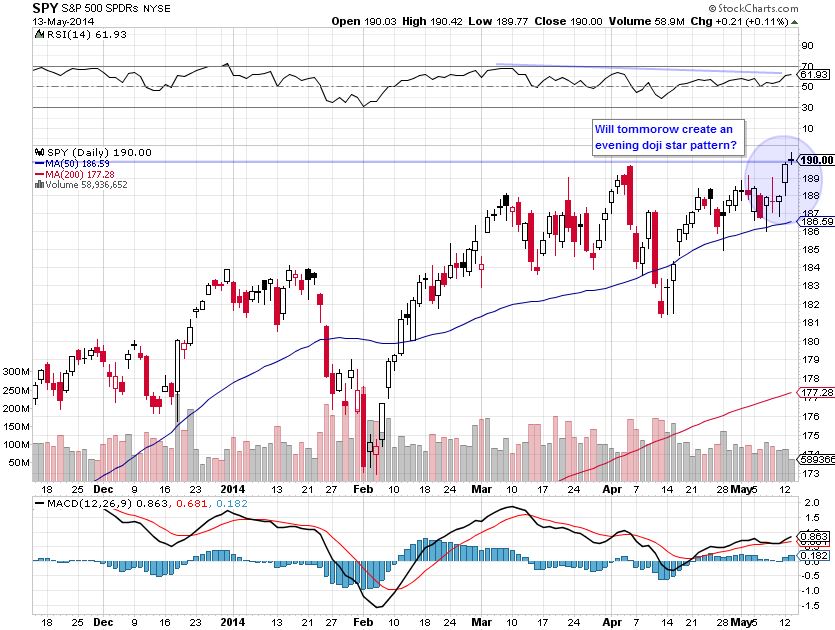
Under the Hood:
Yesterday I said price action was positive, though the negative RSI divergence and low volume was cause for concern. Price action is still positive. Longer term, higher highs and lower lows are still there. Short term, the “doji” candle that printed today is cause for pause. The key is tomorrow’s price action. If we get a gap down with a long bar, an “evening doji star” candle formation will print. This is bearish, especially at highs. If that happens expect a pullback to the 50 day moving average.
Bearish Evening Doji Star pattern
We don’t know if this is what will print. However, it pays to anticipate. T2108 and A/D line are neutral.
Trading Game Plan:
If you are already short SPY, as I am, keep stop in place above today’s doji. Those looking to enter, try to get in as close to today’s price bar as possible. If there is a gap down tomorrow, there will likely be a pullback toward the doji bar that would provide a good short entry. As discussed before, an entry here with a target near the recent lows at $182 offers 4:1 risk ratio. Even if the target is the 50 day moving average, we get an acceptable 2:1 ratio. If price breaks 190-191, we re-evaluate. Key points will be strength of price and volume action at breakout and breadth indicators. A pullback here would be welcome as we would get long entries in focus list stocks like NFLX and JAKK.
The Focus List
Here we find actionable setups culled from “the watchlist” for the coming trading day. Today’s new addition to the focus list is GDP. Price broke the post breakout trendline and gained almost 5 percent on a lackluster day for the market. Volume’s not great, and if the market pulls back the stock will likely stop out. However, we and entry at $23.50-24, with a stop at $22.50 and target at the recent high of $27 gives us close to a 3:1 risk ratio. 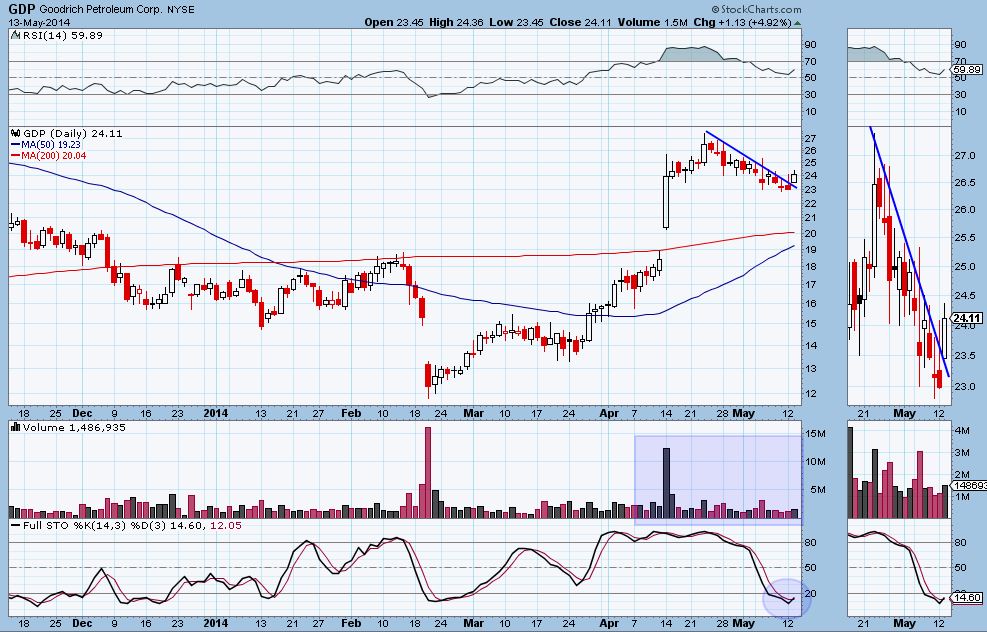 Focus list stock JAKK pulled back as I had hoped. It is near a good entry level, which would be in the $8.50-8.55 range. My concern is that if the market pulls back, JAKK will pull back to a different level of support, either the 50 day ma or $8.25. Still, with an entry at $8.50, with a target at $9.40 and stop at $8.20, we get a nice 3:1 risk ratio. Breakout traders can wait for an upside break of the triangle.
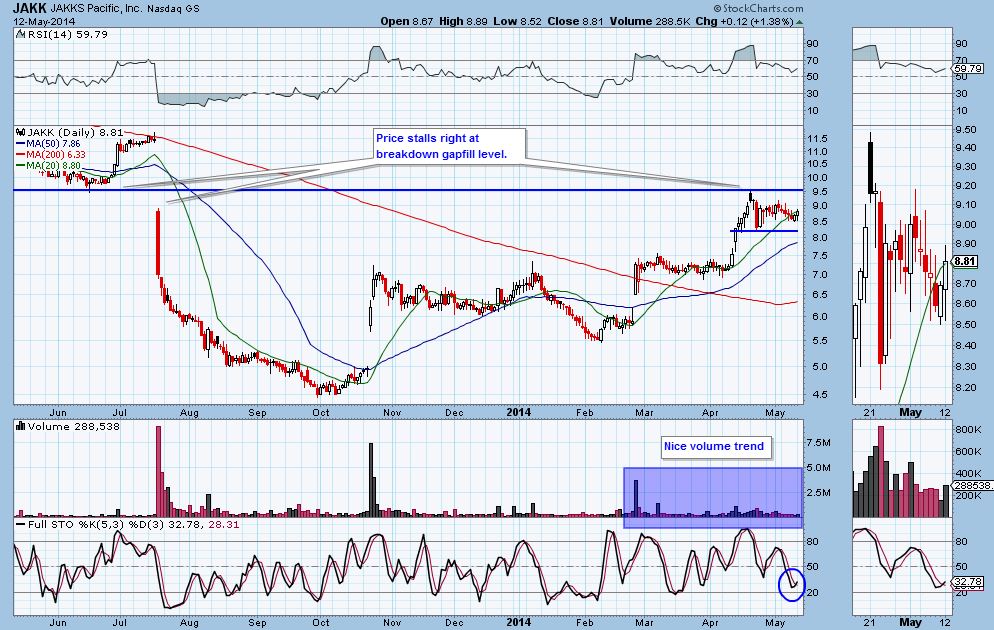
 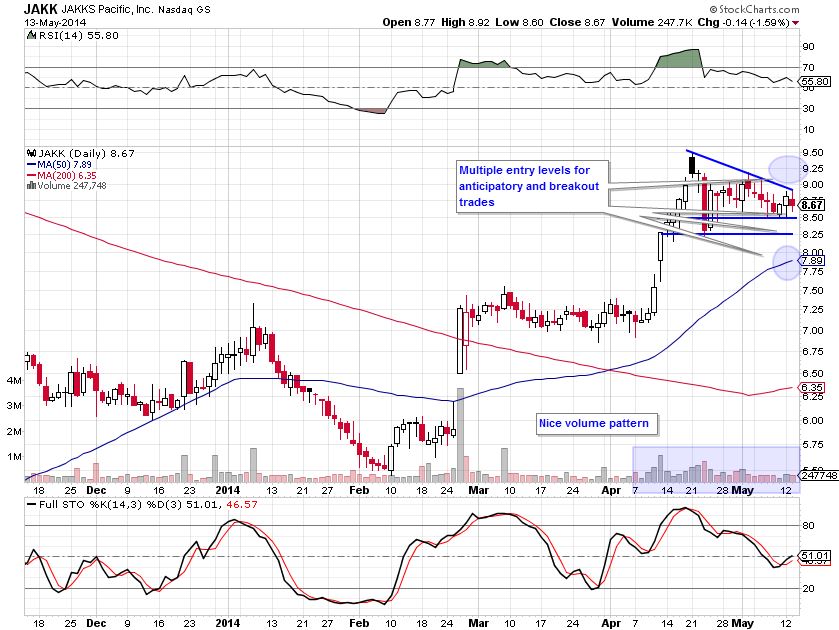 Yesterday’s JAKK chart.
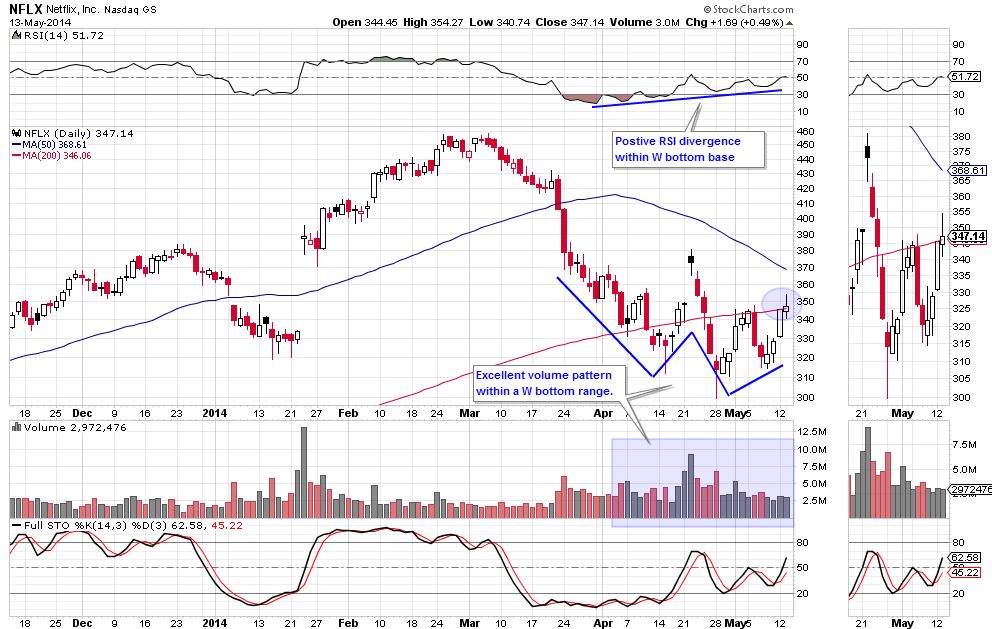
  Focus list setup NFLX printed a candle similar to SPY, right at resistance. If the market pulls back, NFLX should hit our entry level for the “W” bottom setup, in the $315-325 range.
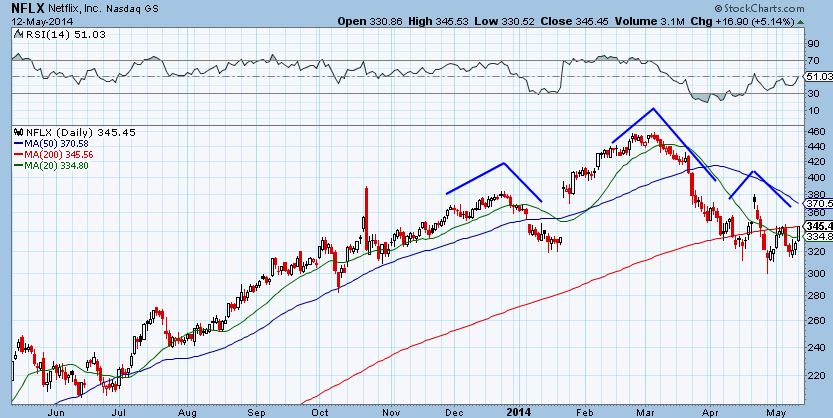
  Longer time frame shows head and shoulders top formation (yesterday’s chart)
The Watchlist
As expected in what amounted to a break even day, the watchlist was a mixed back. Aside from GDP, nothing important to note. Even big losers like NXPI and HDB did little to change the existing patterns. 
Market Leaders
These are stocks that I always watch, though they might not be in my tradeable watchlist, nor are they actually always leading the market (TSLA and NFLX certainly haven’t in recent months). All but one of the market leaders thoroughly beat the market today. I admit I am surprised by this given the expectation of a market pullback. GMCR is on fire and gapped right up to resistance. 
Sector and International ETFs
This list of “watchlist” ETFs is used a number of ways. Most are market leading ETFs that I use to find watchlist stocks using a “top down” approach. You’ll notice in my watchlist that a number of stocks come from healthcare. materials and energy, sectors that are represented here. I also trade ETFs that have good setups. Finally, following sector ETFs can give you an idea of where money is flowing and an overall gauge of the market. I carefully watch the 5 and 30 day price trends versus the market. This gives me an idea of where money was and is flowing. Money continues to flow into India, which surpised me since Indian watchlist stocks HDB and IBN were down today. The 5 day in oil went from positive to negative. 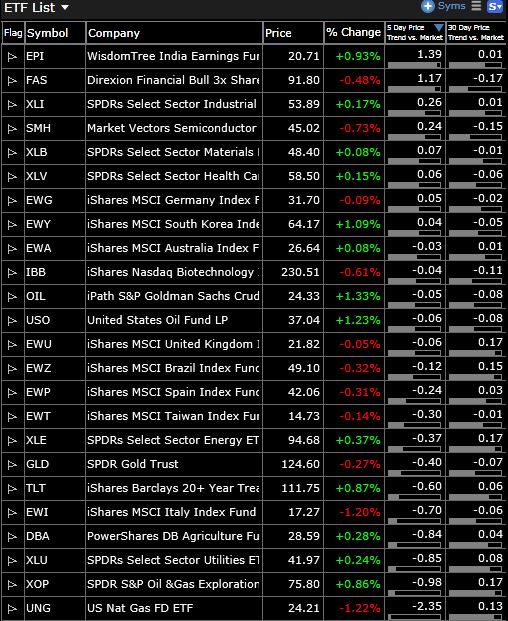
Current Trades
Since this is the second report, there are no current trades. However, I am short SPY near close yesterday and long UA.
Trader Education
Yesterday we talked about patience with entries. If the market pulls back, many traders will get trigger happy and enter on a shallow pullback before the buy zones are triggered. For instance, focus list stock NFLX needs to get down to at least $320 to provide a good risk ratio (if placing a stop under support). Our brains tell us we need to enter before losing out if the stock jumps. That’s okay. There will be other trades if that happens. Back in the day we had to grab every opportunity for food, because if we passed on those berries, we didn’t eat. Don’t worry, if NFLX jumps prior to entry level, you’ll won’t go hungry. Enjoy this post? Over the next two weeks we will be rolling out a new swing trading service with Paul Singh. To learn more, emal info@bullsonwallstreet.com !


