We have a real treat for you today. Exclusively for our bootcamp students we hold live market recap sessions where we review the biggest moves of the day and my personal trades. Today we decided to share our recap session with the public so you can get a taste of how we dive deep and analyze our trades for the day.
SPY
The first thing we do in each session is take a broad look at the overall behavior of the market. On July 13th, we can see that the market is pushing up towards its all time highs. For the last month, the SPY has been consolidating by setting up for a huge flag. But after this recent push, it won’t be surprising to expect a rest for the next few days. Overall, all you can really ask for is a strong market and that’s what we have. We saw a similar move in Nasdaq after its distribution making run to possibly $142 in the next few days.
TGT
I caught some decent trading action for my first trade of the day being Target. TGT gapped up into resistance, so my thinking was actually to short it. These retails stocks that have been gapping have been giving back its gains. As it spiked up, I shorted it covering some at the 9EMA. When it held this MA and the gap didn’t fill I realized it would hold. I covered and got out.
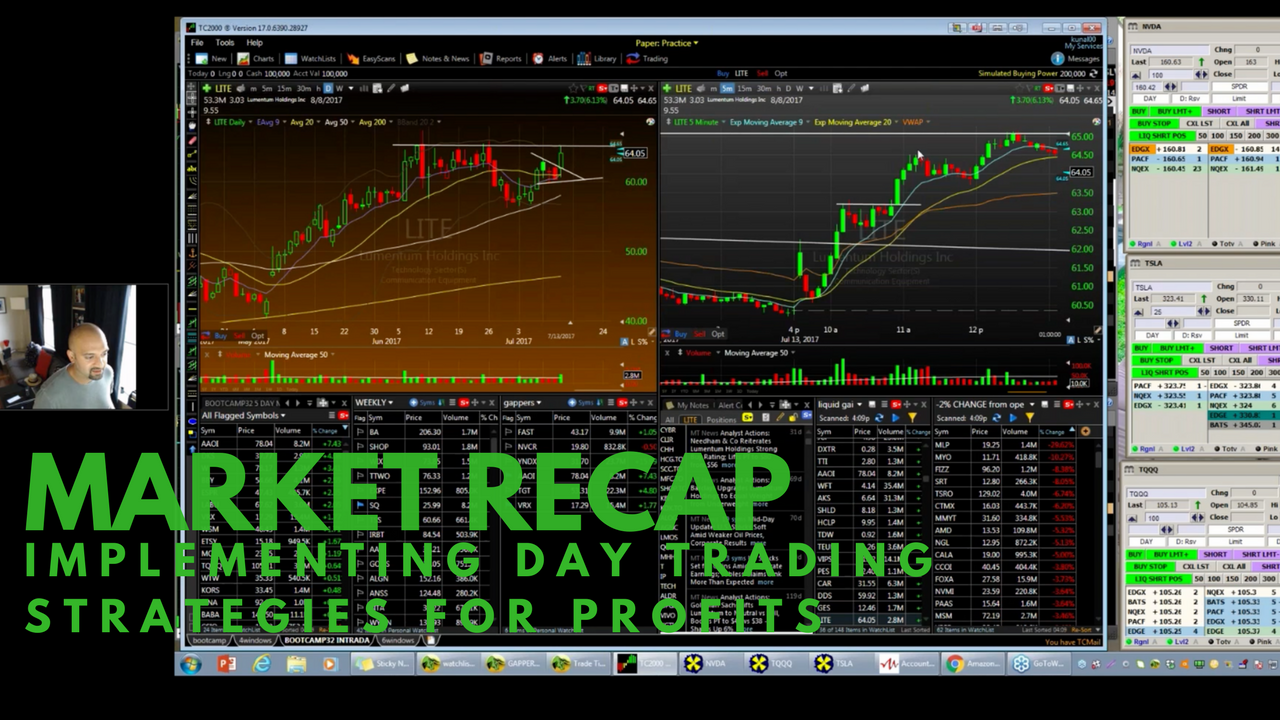
AAOI and LITE – Flag Patterns
I took two flag patterns in AAOI and LITE. AAOI stock gapped up on earnings. So after it pulled back to the 9 EMA and broke over VWAP I added 300 shares. I sold off half into the first spike taking a dollar, and then kept half. I anticipated another break out so I re-added, only to get hit with a huge $2 red candle stopping me out once it fell under the VWAP. But as it started to round and flag, I hit the setup at 500 shares and sold off half into the next spike. As it reflagged up top I re-added, selling for a bit of profit.
LITE is a sympathy play as it’s in the same sector as AAOI and runs at the same time. After it gapped up, LITE pulled back but then ramped up hard. I missed the first move but as it flagged with the 9EMA underneath, I hit this flag break with 600 shares. I scaled out into the spike. But as it came back and started to flag again, I re-hit it once more. Remember, you have to keep the daily chart in mind. So I sold off most of my shares near intraday highs knowing that there was a strong resistance level there.
NVDA
NVDA had a big spike at the open, breaking the top of its upper Bollinger Band. This signals a classic rubber band short setup. You can see in midday that NVDA started to make lower highs before it started breaking down. When the MAs are curling right on top of the price, and broke support I took a short with a stop above the EMAs. Boom, it immediately flushed down.
If you’re not sure of the setups and price patterns that we’re talking about you can learn them all here at our Bulls Bootcamp. It’s an intensive 60 day course to teach you exactly how I trade and why. To learn more or signup, email me at kunal@bullsonwallstreet.com today!
