There are certain days in the market, called a “trend day” ,it could be an uptrend or a downtrend day but there will be days when one prominent trend will take over. Today April 25th was one of those classic trend day to the downside. As a trader you need to recognize what is the primary trend and stay with the current trend. On a down trend day many traders including me ,will have urge for a dip buy , hoping for a bounce because stock has been down so much for so many days but counter trend trading or trading aginst the trend on a trend days is extremely stressful unless you are scalping 10/20c here and there. Most traders start the trading day with certain bias on a particular stock whether it will be an up day or down day or bounce day for that stock. As a human being, we like to stick with you our initial biases but when it comes to trading, trader needs to be flexible and change the bias based on technical chart setup. Step back from your desk if you are in the wrong side of the trade, look at the chart from a distance and try to see the bigger picture and what the setup is trying to tell you.
Let’s look at an intraday chart for biotech ETF . Many biotech stock has been down for few days.Many traders including me were trying to play bounce on some biotech names without any success. If you look at underlying biotech ETF the picture was quite clear. IBB broke 2 day support right at the open, signaling a trend change. Usually when a support or resistance is broken at open and it does not get recaptured within 1st hour of trading, it will start a trend day. On a down trend day every bounce is a suspect until otherwise. Instead of focusing on a bounce or a dip buy, trader needs to embrace current trade and execute trade in that direction.
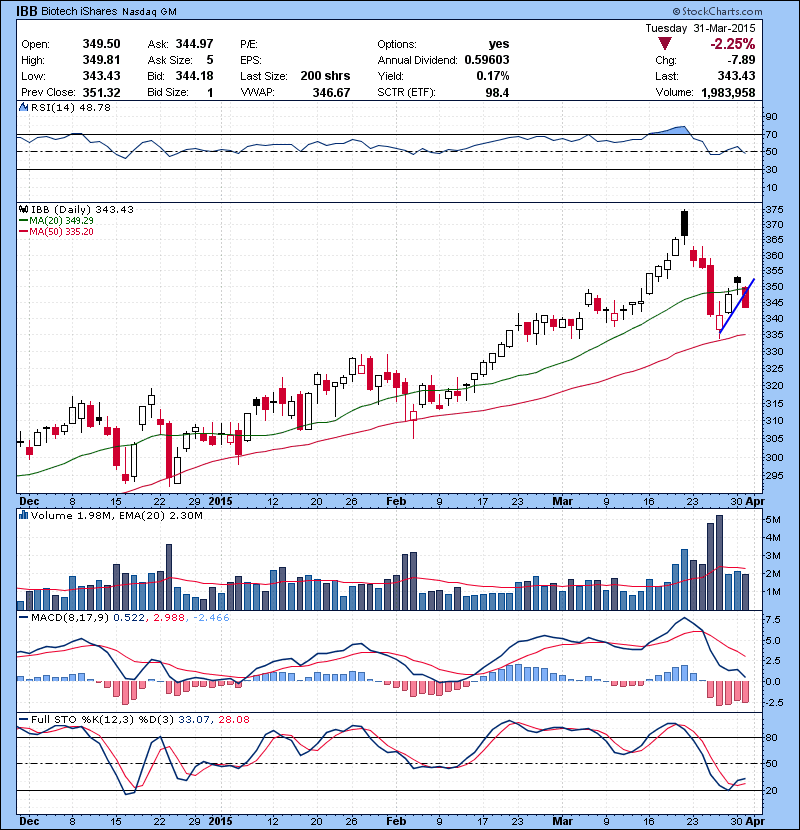
- Short term support is broken at open, signaling a trend change
- Dead cat bounce attempt, fade at moving average ,failure to recapture support during the 1st hour of trading signals a “trend day”. Every bounce is a suspect here until otherwise.
- Trend down day continues as you can see pretty much every bounce was faded.
- Finally we have some basing period. Even here bounce still a suspect until the breaks out here and starts a new trend.
- Stock fades yet again at resistance and downtrend continues yet again and end of the day climactic selling.
If you are struggling with your trading or learn how to trade you need to join our 60 day Bootcamp course. Our program is designed in such a way that you come out of it ready to trade live in just 3 months. We teach you everything from risk management to scanning to trading strategies. I also share my profitable intraday trading strategy which will make you money short term regardless of Market condition. The class is one of a kind, see why you should sign up for the course here . You will also have access to a private community where you can ask questions, share charts and talk with the instructors or other traders. You can also check out the testimonials from our students.
Also if you are interested in our trade alert services and chat room , take a free trial! Check them out here.
Follow me on Twitter @szaman and on StockTwits @szaman
Check out our newest Offering “Bulls Vision” ! A brand new screen share product! See through the eyes of @kunal00 while he trades live everyday.
