
A stock trend can be thought of as the path of least resistance in a stock. There are both up trends and downtrends in stocks. An uptrend occurs when a stock is making higher highs and higher lows. A downtrend is simply the reverse: Lower highs and lower lows within a specific time frame. The reason that trends are important is because a stock will stay in its primary trend until a force greater than or equal to it is thrust upon it.
Having the ability to recognize when a stock is about to begin a strong trend or end one is one of the most valuable skills you can develop as a trader. As traders, the lowest risk and highest reward trades come when you trade in the direction of the primary trend. Day traders, swing traders, and investors all use different time frames to monitor trends. In this article, we will discuss how to identify forming trends, how to identify the strength of a trend, and how to identify when trends are ending.
How To Identify Stock Trends
An object stays in motion until a force equal or greater is thrust upon it. This is the fundamental tenet of physics, Isaac Newton’s first law of motion. Stocks are the same way: a trend, once it’s started, is more likely to continue than reverse. Stocks are the same way. Once a trend is started, it’s more likely to continue than to reverse. Stocks can stay in trends for much longer than anyone expects and often won’t reverse until a force equal or greater is thrust upon it.
The strongest and longest trends will often occur when a stock has no overhead resistance (price points on a stock’s chart where a stock’s trend is likely to reverse due to a history of supply being there) and is breaking out to all-time highs. This is what we call the “path of least resistance,” as a stock will just keep following its trend until a source of supply that’s greater than the demand can challenge it. This is the whole basis of trend trading.
Uptrends
How does an uptrend start? Once a stock makes higher highs and higher lows on a particular time frame, an uptrend has formed, while a stock making lower highs and lower lows is a downtrend. Moving averages are useful for showing you what the stocks trend is. Check out the SPY daily below:
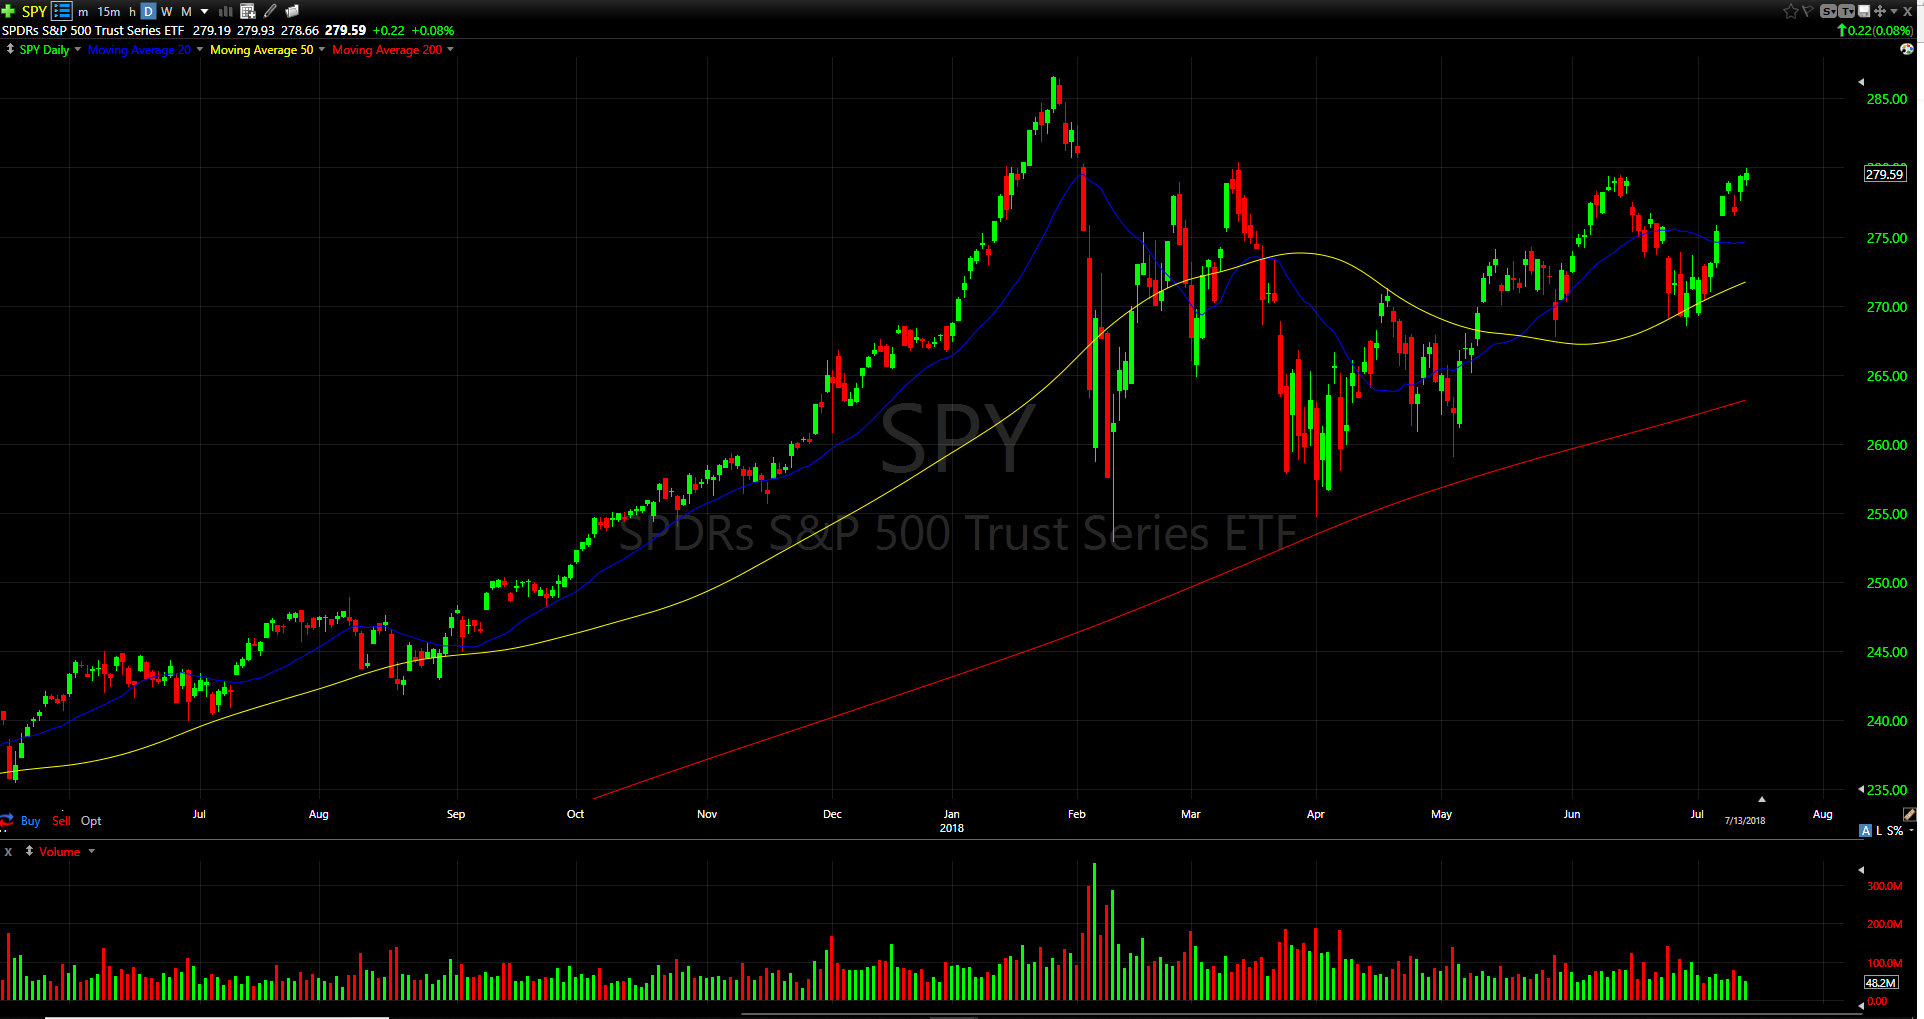
Remember that 20 SMA = short-term trend, 50 SMA = intermediate trend, and 200 SMA = long-term trend. You can see how long it was trending with its’ 20 and 50 SMAs last year, showing clear signs of an uptrend.
Signs of Trend Reversal
You need to understand the signs of a trend reversal in a stock in order to become a profitable trader. Once a stock (or any type of asset class) exhibits a trend for an extended period of time, a trader must be on the lookout for potential clues the trend is weakening. As you can see above, moving averages are a great way to tell when a stock’s trend is reversing. Once you identify what moving averages a stock is trending with, you can use a break below these moving averages as a sign the trend is changing. The SPY was trending with its 20 MA (blue) and 50 MA (yellow) for all of last year. See how much panic came in on the SPY chart above this year once we broke below the 20 and 50 SMAs moving averages.
Sign Up For The Free 4-Day Live Course
If you missed our last post of the Bulls Elite Series breaking down a day trader’s trading day, you can check it out here. We will go in more depth about how to identify stock trends and trend reversals in our free 4 day live course on July 22nd.
Reserve your seat for the free 4-day live course here.

PS if you’re coming let us know on Facebook and share this event with your friends. Click here to join our Facebook event.
[rf_contest contest=’10758′]
