Earnings season is the best time of year for momentum traders. Every day there are dozens of stocks gapping up and down in reaction to quarterly earnings reports. With earnings season right around the corner, now is more important than ever to know how to master earnings plays. For this reason, we made you a complete guide and checklist for earnings trading:
Why Trade Earnings Plays
Earnings is a time where investors on all time horizons are making a decision about their positions. Big players make their decisions off of quarterly earnings reports. This means that big moves in either direction will often follow these reports, as these players enter and exit positions in a stock. A ton of range and volume will come into these stocks, and this means there is a ton of opportunity to make a lot of money in a short period of time.
10%+ moves in either direction are very normal in the morning following earnings reports. Stocks will often go on monster multi-day/week runs following earnings reports, creating great opportunities for swing traders. Earning season comes around four times a year, and usually lasts for 2-3 weeks. Mastering earnings trading will give you a skill set you can use to make money for the rest of your life.
Earnings Season Months
In general, look for companies to release their earnings in January, April, July, and October.
Checklist For Earnings Plays
Here’s the biggest secret about earnings trading: the actual earnings report doesn’t matter. Only the reaction to the earnings. Whether the company beats guidance or falls short doesn’t affect how you should trade the stock. I’ve seen stocks with great reports sell off completely as soon as the market opens. I’ve also seen stocks with terrible earnings reports squeeze up 10%-20%. Price action is the only thing that matters. Here are the primary 4 things you need look for before trading any stock reacting to earnings:
1. High Relative Volume
The best earnings plays always have high relative volume. High relative volume always precedes every major move in a stock. It means there is a high probability that there will be an explosive move in the stock that day. High relative volume means that the stock is trading 5 million shares that day, when it usually just trades 500,000 a day on average for example.
You can always tell by the premarket volume and the volume at the open if a stock will have high relative volume that day. If this stock that trades 500,000 a day on average trades 200,000 shares in premarket, it is a day where there is high relative volume. If the market open and this stock trades another 300,000 shares during the first 5 minute candle, that means there is high relative volume.
2. History of Running on Earnings
One of the most important factors to consider is a stock’s history of reacting to the earnings catalyst. A lot of stocks don’t get much momentum after an earnings report. You only want to be trading stocks that have made big moves in the past in reaction to earnings. History repeats itself in the stock market. You want to go back and look at a stock’s daily chart, and see how it reacted to earnings reports in the following days after an earnings report. This will tell you if the stock will likely make another big move. AMD is great example of stock that is great to trade on days it reacts to earnings:
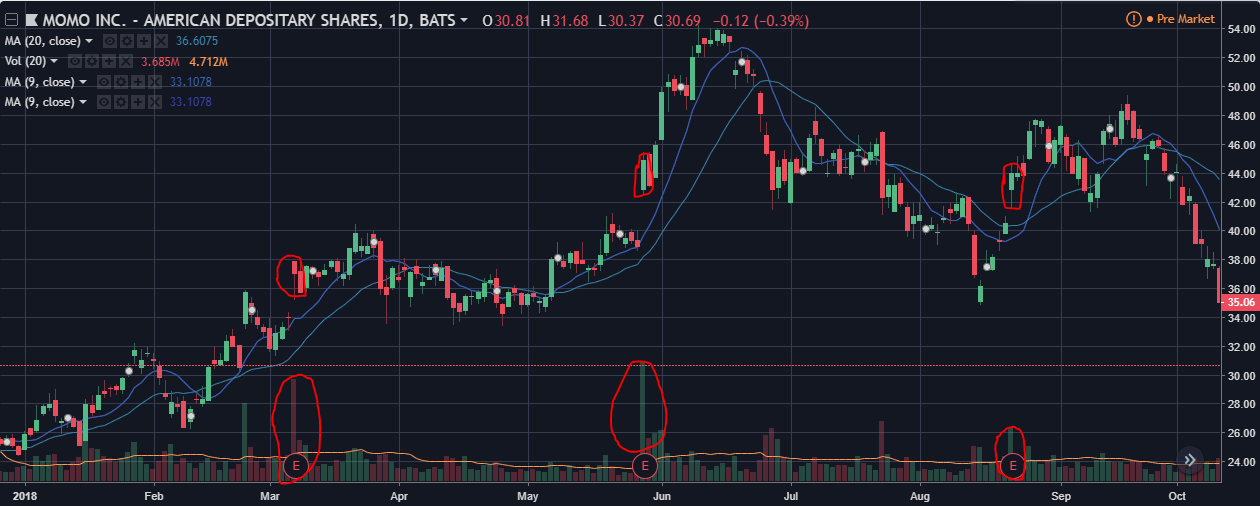
You can see how much range comes into the stock after it has had an earnings report. Also notice the high relative volume that always comes in after, and how much it gaps up and down from the previous day. This is a good example of a stock to trade when it has earnings.
3. No Nearby Resistance/Support
The best earnings plays gap up over all nearby resistance levels to the longside. The best earnings breakdowns gap down below support when you are short-biased. The less price history to the left the better. When there is no nearby resistance there is less supply to stop the stock from increasing in value. When a stock gaps below support there is lower probability of the stock finding buyers. Always look at the daily chart to see where a stock’s key support and resistance levels are prior to trading it.
4. Large Range
Stocks like MSFT and CSCO don’t interest me because they only usually move 1%-2% a day. I want stocks that have the potential to make 5%, 10%, or even bigger moves. The goal is to capture a piece of whatever the stock is moving that day, if you are day-trading it. It is almost impossible to catch the complete move a stock makes. If a stock makes a 10% move in a day, it is rare to make a full 10% on a trade you make in that stock. However, it is realistic to capture 5%. If you only buy $5000 of that stock for that trade, you will make $250. These gains add up once you develop the skill set to do this consistently and scale it.
Get Started With Our Free Trading Kit
Our trading kit is the best free resource out there for new and struggling traders. It includes:
- Intro to Trading Course
- Comprehensive Trading Handbook
- Trading Consultation
