Everyone is on the hunt for an edge in this bear market.
In this type of market, you HAVE to be using proven strategies with an edge. In this type of volatility, blindly buying dips is the fastest way to blow up your account. Many retail traders have already learned this lesson the hard way.
Don’t be one of those traders. Today we will talk about one of our favorite day trading strategies that has been a consistent breadwinner for us in this bear market.
That strategy is called the ATR Short, and this will immediately help you become a more profitable trader this year:
What is ATR (Average True Range)?
ATR stands for Average True Range, and is it an indicator of simply that, the average range of a stock from its high to its low of that particular day, compared to the past 10-14 day periods typically. Basically, we are looking at the candlestick size.
For our strategies, we like to participate in stocks with a high ATR, because they have a very wide range that they move in day in and day out, which of course leads to opportunities to profit within those ranges.
How to Put ATR on Your Chart
Adding ATR to your charts is very easy. You can also add it within watchlists and scans. We use TC2000 here at Bulls on Wall Street, and if you simply go to “add indicator”, you are able to search and add ‘Average True Range’ to your charts.
The ATR figure will show up in the top corner of your chart. Remember, that us how much on average the stock moves from high to low in a day.

What ATR Figure Should You Use?
Many people use the 14 day period ATR, but we like to use the 10 day. Again, ll of that is doing is taking how much the stock moved on average over the past 10 days, and plotting that.
Knowing WHEN To Use This Strategy
Knowing what the macro-conditions of the market are is very crucial. Using this strategy in bear markets that have been drawn out or going on for months is the best scenario.
The Core Concept Behind The ATR Short Strategy
This bear market has been prolonged for a while, really since the early part of this year. That means, stocks are really beat down to this point, so we don’t want to be chasing them. That is why we trade this ATR Short Strategy, which is essentially shorting on strength.
What happens in a bear market is there is FOMO and belief in the market, and any time the market or the stock opens up green in a bear market, people believe this is the bottom. So, what we are doing is taking advantage of that false belief that this is the true bottom, and shorting into false-strength when a stock meets or exceeds its ATR on the day. We are looking for a quick reversion back into the range.
Trade Examples
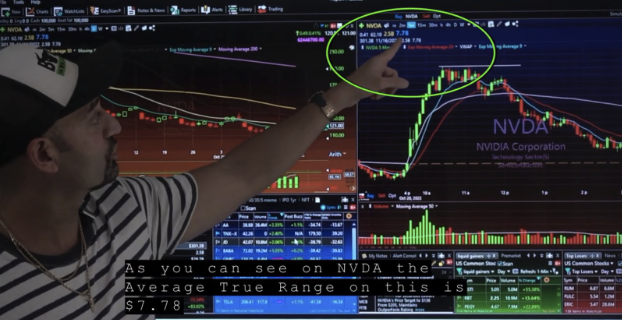
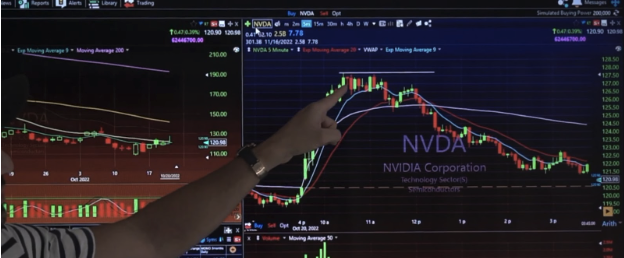
For example, $NVDA here opened up and had a big push at the bell. It’s ATR we know by looking at the blue number in the left hand corner of the chart, is $7.78. $NVDA traveled already $7.50 at the bell.

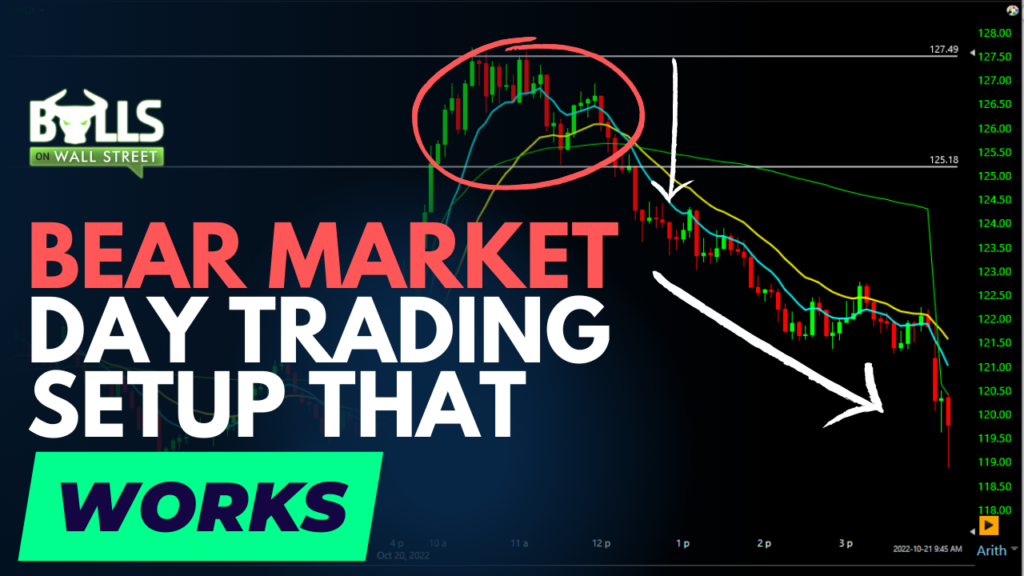
As you can see at the top, the stock started to consolidate at the top of the range after a big run up. It is starting to try to create a bull flag. In a bear market though, bull flags rarely tend to hold up, so that is precisely what we are looking to short when it breaks down. We like to short the break of consolidation, or lower highs, after a stock has traded its ATR, and the 9EMA is starting to curl down, just like in the picture above.
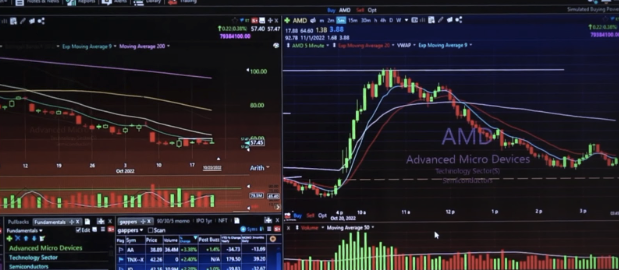
The same thing goes for $AMD here below. After a big move up in a bear market, $AMD started to consolidate at the top of the range AFTER trading its full ATR for the day, the 9EMA started to curl down, and the stock started to fade.

Conclusion
The meat has dried up on the bone so to speak on chasing downside momentum. Simply, we are running out of room just chasing bear flags and range breaks to the downside all day. You want to be shorting STRENGTH in a bear market using strategies like the ATR short here. That will keep you safe and will make sure you always are taking high probability trades!
Get Early-Bird Pricing For Our Next Live Trading Boot Camp (2 Days Left)
Click here to apply for our next trading boot camp!


