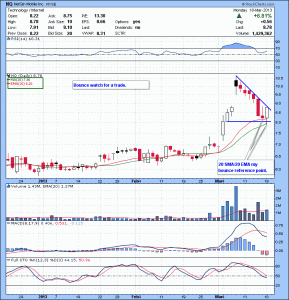
NQ was on last night watch list as a bounce play. Stock had huge volume run up to 10.67 and severe pull back without any bounce and down for 6 days. As it approached 20 SMA/20 EMA on daily chart, i was eying the stock for a bounce soon, somewhere either around 20 EMA or around 20 SMA. 20 EMA is around 8.20 area, 20 SMA is around 7.90 area . Now these two numbers are my reference point for the stock.
As you can see on the daily chart, yesterday the stock manged to close above 20 EMA 8.20 This morning the stock went down along with general Market and touched our magic area 20 SMA 7.90 area.

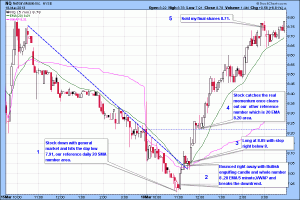
Let’s see the intraday chart to see how the trade setup.

1.Stock down with general market and hits the day low 7.91, our reference daily 20 SMA number area.
2.Bounced right away with Bullish engulfing candle and whole number 8 ,20 EMA/5 minute,VWAP and breaks the downtrend. So many confluences. Always, the more , the better.
3.Long at 8.05 with stop right below 8, that’s all that confluence area.
4.Stock catches the real momentum once clears out our other reference number which is 20 EMA 8.20 area.
5.Sold my final shares 8.71 and took partial profits along the way.
Nice and clean .64c gain with .05c risk ,almost 1:12 risk reward.
If you are interested in trading these low risk/ Huge gains setups with us and learn trading, live in a chat room with a super team of traders, please email for info. thenyctrader@gmail.com
Follow me on Twitter and StockTwits @szaman
$NQ: Strategy to play bounce after severe sell off.
NQ was on last night watch list as a bounce play. Stock had huge volume run up to 10.67 and severe pull back without any bounce and down for 6 days. As it approached 20 SMA/20 EMA on daily chart, i was eying the stock for a bounce soon, somewhere either around 20 EMA or around 20 SMA. 20 EMA is around 8.20 area, 20 SMA is around 7.90 area . Now these two numbers are my reference point for the stock.
As you can see on the daily chart, yesterday the stock manged to close above 20 EMA 8.20 This morning the stock went down along with general Market and touched our magic area 20 SMA 7.90 area.
Let’s see the intraday chart to see how the trade setup.
1.Stock down with general market and hits the day low 7.91, our reference daily 20 SMA number area.
2.Bounced right away with Bullish engulfing candle and whole number 8 ,20 EMA/5 minute,VWAP and breaks the downtrend. So many confluences. Always, the more , the better.
3.Long at 8.05 with stop right below 8, that’s all that confluence area.
4.Stock catches the real momentum once clears out our other reference number which is 20 EMA 8.20 area.
5.Sold my final shares 8.71 and took partial profits along the way.
Nice and clean .64c gain with .05c risk ,almost 1:12 risk reward.
If you are interested in trading these low risk/ Huge gains setups with us and learn trading, live in a chat room with a super team of traders, please email for info. thenyctrader@gmail.com
Follow me on Twitter and StockTwits @szaman
Share:
Stock & Option Software used by Bulls on Wallstreet
Social Media
Related Posts
Market Speculator Part-Time | Swing Trade Report
Trading Watch List 02.05.2025
Market Speculator Part-Time | Swing Trade Report
Market Speculator Part-Time | Swing Trade Report
Stop Guessing.
Start Trading.
Don’t Miss Out
Pre-Market Live-stream
Tuesday’s and Thursday’s at
9:00 AM EST.