Quick Summary
SPY gave up yesterday’s gains and is basing above 50 dma. If the moving average breaks, we start scanning for shorts other than market indexes. Focus list longs are all near long entries. EMES and BEAV were removed from focus list and are back on watchlist. Entered CODE today. Watchlist stock URBN and Market Leader stock CAT both broke down hard today. We’ll watch in coming days to see what sets up. RRGB, CDNS, WOOF and DVN are new entries to the watchlist.
The Market
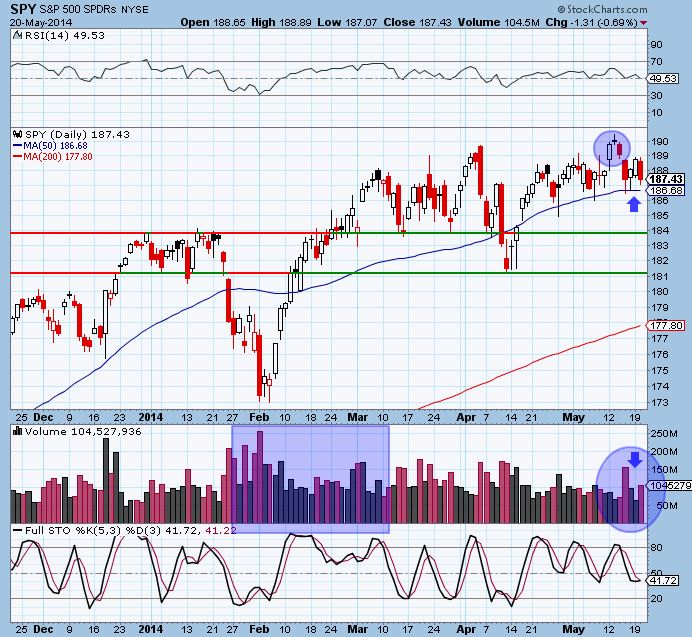
Key Pivot Levels: 190.42: new high resistance 186.64: 50 day moving average 181.31: recent low 181-184: plenty of buying in this range.
Under the Hood:
Today SPY gave back the gains from yesterday, forming a 4 day base just above 50 dma support.. It’s interesting that volume picked up today, a down day. Study the pattern over the past few days. Even big up moves in price are on weak volume, while down days are on high volume. This is not a good sign for those looking to take out the recent highs. If highs do get taken out, and volume remains low, the likelihood of a breakout failure increases.
Compare this to the upmove from Febuary to mid-March. Some have used this period to justify the idea that “volume does not matter” because positive volume during that period was lower. They are not interpreting the volume patterns correctly. While it is true that in late February there was big downside volume, followed by an upmove on lower volume, the downside volume was “blow out” type volume that washes out novices looking to get out of positions. After “event volume” it’s important to judge volume on the upmove relative to the new trading range, not the event volume. Here, volume within the range was positive. Even the biggest down day within that upmove was misleading if not looking at the price bar. That price bar printed a “hammer” candle (strong close way off lows), which is actually positive.
Current volume is not “event” volume, it is distributive volume signaling that the big players are slowly moving out of positions. This is not a bullish signal, and allows for fading strength.
If SPY corrects more, we should see buying interest in the $181-184 support zone.
Bearish Evening Doji Star pattern provide short opportunity at resistance levels.

T2108 (stocks trading above 40 day moving average) and A/D line are neutral.
Trading Game Plan:
Continue to hold remainder of SPY short positions. The SPY bounce trade is nearing stop level if did not take profits yesterday (a separate trade of same stock on different time frame). Continue to look for pullbacks to support in watchlist stocks. Right now I am content to use SPY or leverged ETFs as my short vehicle, since no major negative trends have emerged. If the 50 dma breaks, I will start adding short setups to my watchlist .
The Focus List
Here we find actionable setups culled from “the watchlist” for the coming trading day.
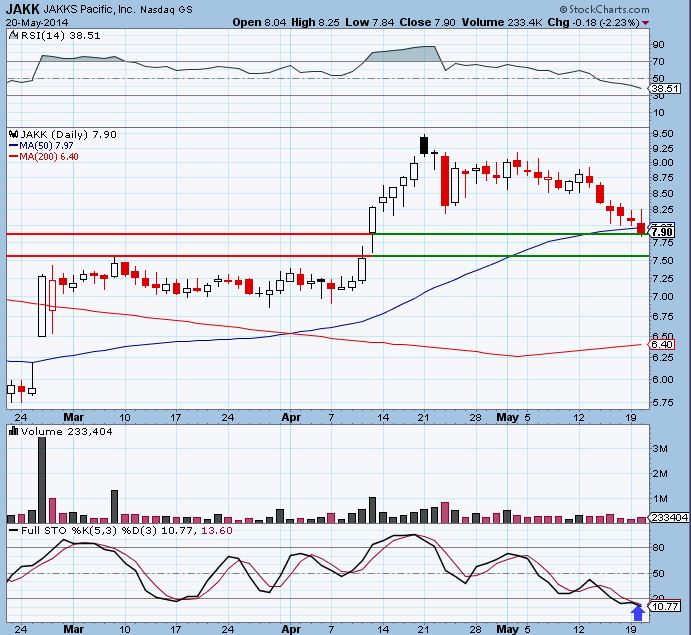
JAKK is in a tricky spot. Yesterday we talked about entering above the 50 dma, but today it slid down below it. However, there are still a few support areas near. We have the breakout bar at $7.90 and the support line below it at $7.50. There is no way of predicting which support line it pulls back toward. Note that if you do enter here at $7.90, a stop would probably need to be placed under that lower support line around $7.40. That means you are risking 50 cents, so you need to have a target that is at least giving you 2:1, or $1.00.
Note the extremely oversold stochastic indicator.
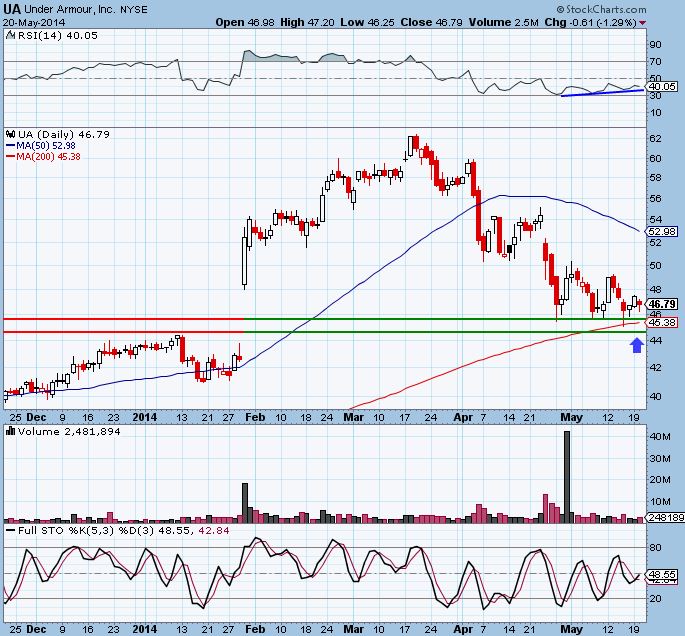
Little has changed with UA and it still provides an attractive entry providing a good risk ratio, and converging areas of support (price and moving average). Converging support lines strengthen support levels. Targets are around $50 and $53 (50 day moving average). Stop around $44.50
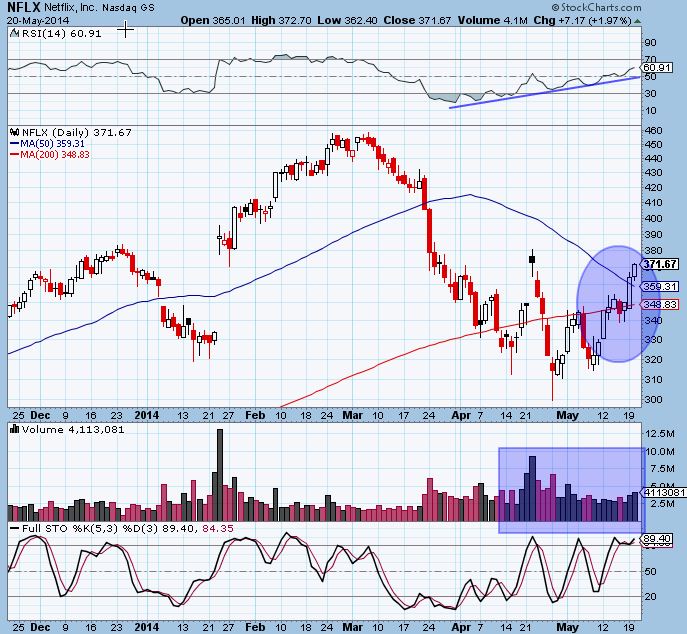
NFLX continued it’s move above the 50 dma. RSI remains strong and the volume pattern is solid. The only way for me to enter is on a multi-day low volume pullback.
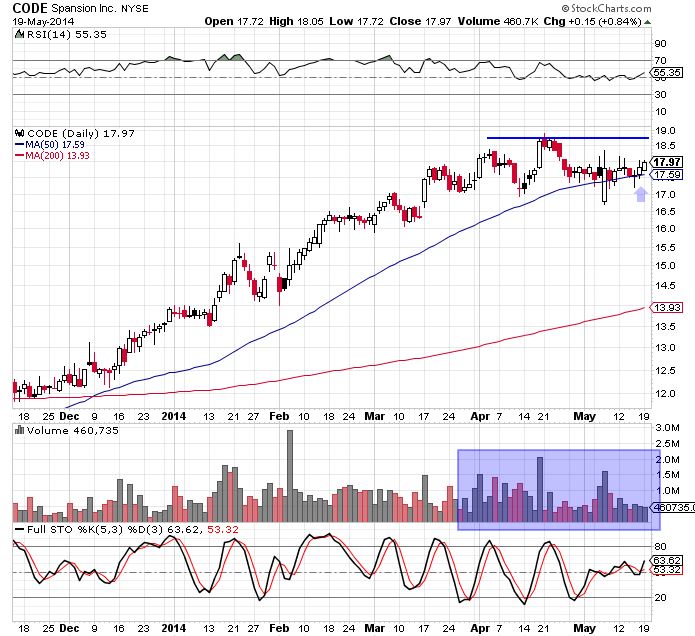
CODE is basing above the 50 day moving average after pulling back from a multi-year high. The volume pattern is positive. An entry in the $17.60-17.70 range, with a target at $18.60 and stop at $17.35 provides 4:1 risk. I sent an entry alert for this stock today. It closed strong but can be entered on a pullback tomorrow.
Beav dipped below the entry and support level and moves back to the watchlist. I also took the EMES short setup off the focus list for now.
The Watchlist
Not much has changed in the watchlist in terms of entry levels or breaks in support/resistance. URBN is the exception. Down huge on high volume, breaking strong support. We will watch it as both a speculative long and short entry. Short on a pullback up to the downtrending moving averages, which has been a reliable setup, and long if it continues to fall and get extremely oversold (rubber band setup–we’ll talk more about this if the set up arises).
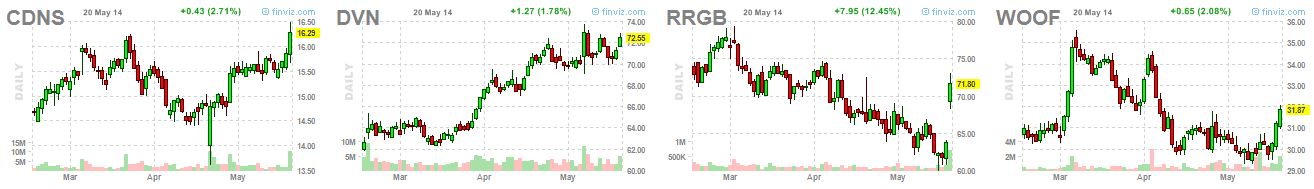
There are 4 new entries to the watchlist: RRGB, CDNS, WOOF, DVN. RRGB’s breakaway gap of a clear downtrend is most noteable. We’ll watch for a pullback entry. The other three are also pullback plays.
Market Leaders
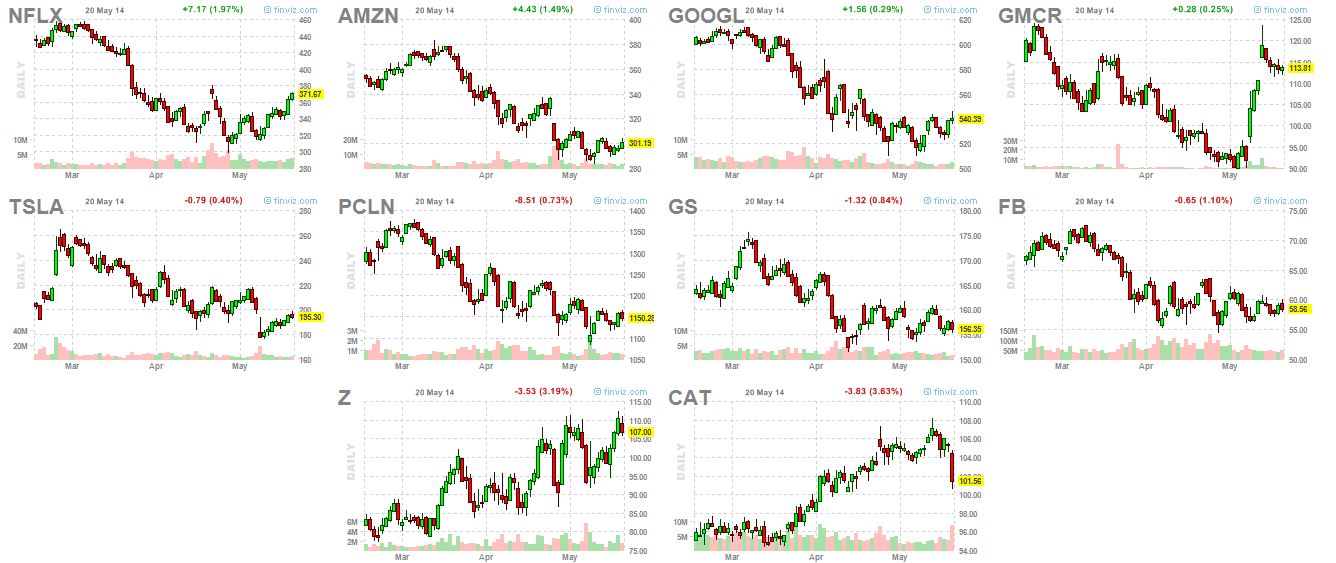
These are stocks that I always watch, though they might not be in my tradeable watchlist, nor are they actually always leading the market (TSLA and NFLX certainly haven’t in recent months).
GMCR still pulling to gap fill area. Watching for $110-111 range. Big news of the day is CAT, with a huge drop on earnings on high volume. There are a number of ways to play this. Short on a breakdown-pullback setup. Wait to see if it ever remounts old highs. Watch for a break of the 50 dma and go short. The trade that I like is the rubber band setup, where we watch to see if there is more downside in the coming days and try to trade a count-trend snapback (more specifics if it starts to setup).
Sector and International ETFs
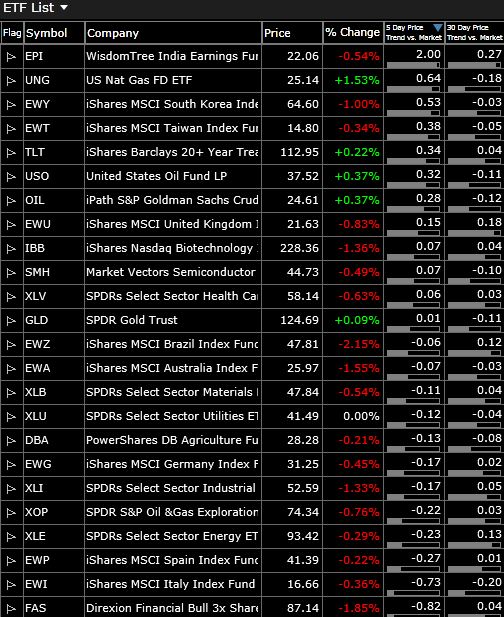
This list of “watchlist” ETFs is used a number of ways. Most are market leading ETFs that I use to find watchlist stocks using a “top down” approach. You’ll notice in my watchlist that a number of stocks come from healthcare. materials and energy, sectors that are represented here. I also trade ETFs that have good setups. Finally, following sector ETFs can give you an idea of where money is flowing and an overall gauge of the market. I carefully watch the 5 and 30 day price trends versus the market. This gives me an idea of where money was and is flowing.
We finally got a little pullback in India and Brazil, but still not close to entry level. Oil remains strong. UNG has picked up the past five days and price is now just under moving average resistance.
Current Trades
Still holding a half position in SPY short after taking profits. Entered focus list stock CODE long today (email alert went out). Still holding UA and GDP, both long. GDP pulled back before hitting the target.
Trader Education
See Market “Under the Hood” for thoughts on volume. For new subscribers, read yesterday’s discussion of reward to risk ratio below. It is important to understand this for my trading style.
The Reward to Risk Ratio:
What is the holy grail of trading? It’s not a setup. It is the reward to risk ratio. The risk ratio is to trading what compound interest is to saving long term. To calculate your risk ratio going into a trade, you must know your entry level, target and stop level. Let’s use JAKK from the Focus List as our example. We came up with an entry at around $8.05, a stop at $7.75, a target at $9. We are risking .30 in order to gain 1.25. That gives us a 4:1 reward to risk ratio.
Why is this the holy grail? Think about what it does to the importance of your win rate. Let’s say you a $30,000 account and risk 1% of per trade ($300 loss). If you have a losing win rate of *only* 40 percent, over the course of 100 trades you will make $30,000, or double up on your account (40*1200)-(60*300). That’s with a 40 percent win rate!
It takes more than just giving yourself a good risk ratio. You must know where to place your stops and targets according to support and resistance, where to enter, how to manage the trade and position size in order to handle draw downs. However, this example shows the power of the reward to risk ratio.
New subscribers and trial members please leave me any feedback/comments in the comments, via email (paul@bullson.ws) or twitter (twitter.com/PaulJSingh)
