Quick Summary:
Thoughts on charting, big money and inside information. SPY and IWM analysis. DAL added as short setup. Key oversold bounce setup levels for market leaders.
The Market
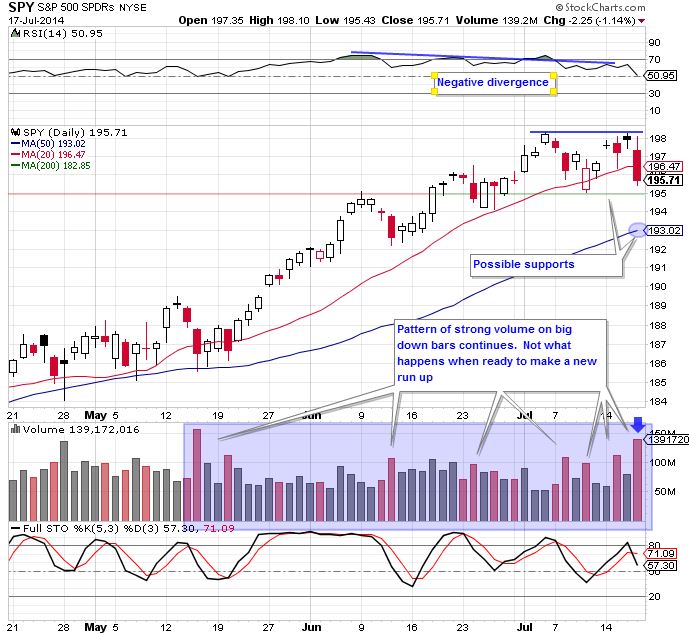
Key SPY Pivot Levels: 198.20 : new high resistance, 196.47 20 dma, 193.02: 50 dma
Under the Hood and Trading Game Plan:
We have been waiting for a day like today. A day where we get a good clue in finding out what the market wants to do. SPY backed off from highs and took out the 20 dma with ease. The key here is that it was on high volume. Even if we bounce here, I believe we are still in pullback mode and the 50 dma will come into play soon. That is my current market bias, that we will get to the 50 dma.
Does that mean we load up on shorts here? No. The move today was too big. However, if we get a bounce to the 20 dma, or even a little higher, I will deploy a few short positions.
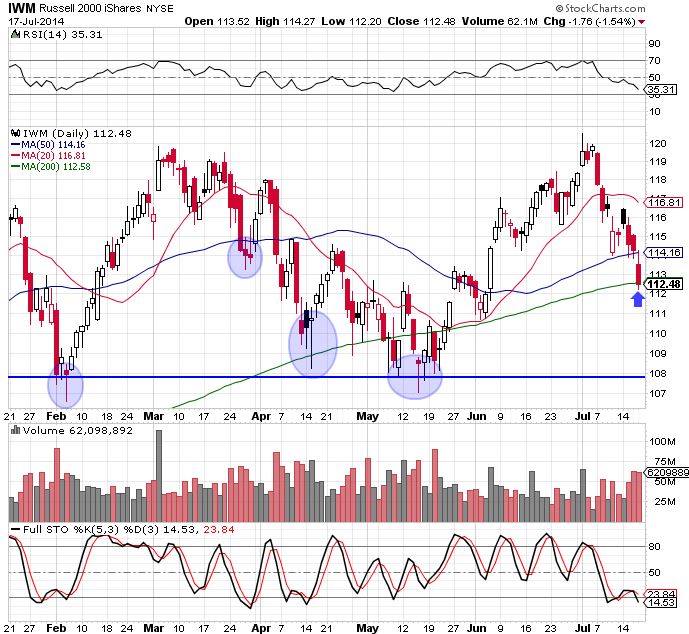
IWM broke the “line in the sand” we talked about yesterday at $114, easily taking out the 20 dma. It is now sitting right at the 50 dma. It is tough to short here, but a bounce would be a good opportunity.
Notice on this chart the “hammers” or long tail candles that have been circled at support levels. These have been fantastic areas for getting long. We will stalk these candles at support levels and try to enter near the close of the day when they develop. They could print anywhere in the $108-111 range.
So if trading IWM, the trade is to short strength and enter on extreme weakness, best when hammers have formed. For those looking for extra leverage, use TNA or UWM to go long, and TWM to short (you short by going long TWM).
While I have noted some trades around the indexes, this is no time to get aggressive. We can still let things play out more. I am going to look at the indexes and some oversold bounce (rubber band) plays for individual equities, along with shorts on pullbacks to resistance, but these will be smaller positions and I will not be using even close to all of my capital.
Thoughts about Charts, Big Money and Inside Information:
Often you’ll hear some money manager talk down on trading charts, or you’ll have someone say your analysis on SPY was “lucky” because of the Malaysian Airliner event (this happened to me today). While charts may not be the be all end all, they offer clues that you just can’t find anywhere else. They offer clues to what the big money and insiders know. Did they know an airliner was going to get shot down today? No, I am not that much of a conspiracy theorist. However, I do believe that certain “very important persons” were privy to more information, inside information, that tensions were on the rise and that there were increased odds that *something could* happen. That was reflected in the charts, even while we were reaching new highs.
The charts helped us prepare. They were speaking to us, letting us know it was time to pullback a little. That something was going to happen. That is why we have been less aggressive (and some of you wisely not trading at all), over the past week. Losses, while more numerous than normal, have been kept to a minimum. In time the charts will talk to us again, letting us know when to get aggressive (either short or long). We’ll be ready when that time comes.
Current Trades
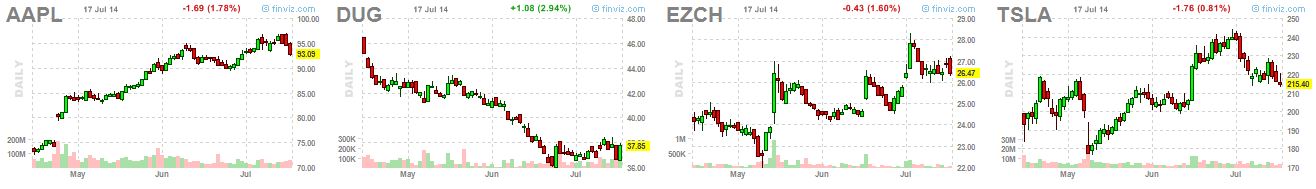
I am still holding AAPL short, and EZCH and TSLA long. AAPL is breaking down just as our negative divergence setup predicted. Those looking to enter still can on slight strength. EZCH is holding the breakout range. TSLA is close to stop out, but the pattern is still fine.
Today I also entered, and was stopped out of DUG. This one was frustrating as the analysis was spot on, we just got stopped out before the stock bounced back. It happens . . .
I talked yesterday about stop gunning and I fear this is what happened with DUG. Notice that the low today was just under the low from yesterday, right where many likely had stops.
The Trade Journal
The Focus List
Last week we talked about having a few stocks in five different categories to key on, but no real entry level focus list stocks. With the pullback and many stocks pulling back to key support, or breakouts that have pulled back, I am going to include the regular focus list this week.
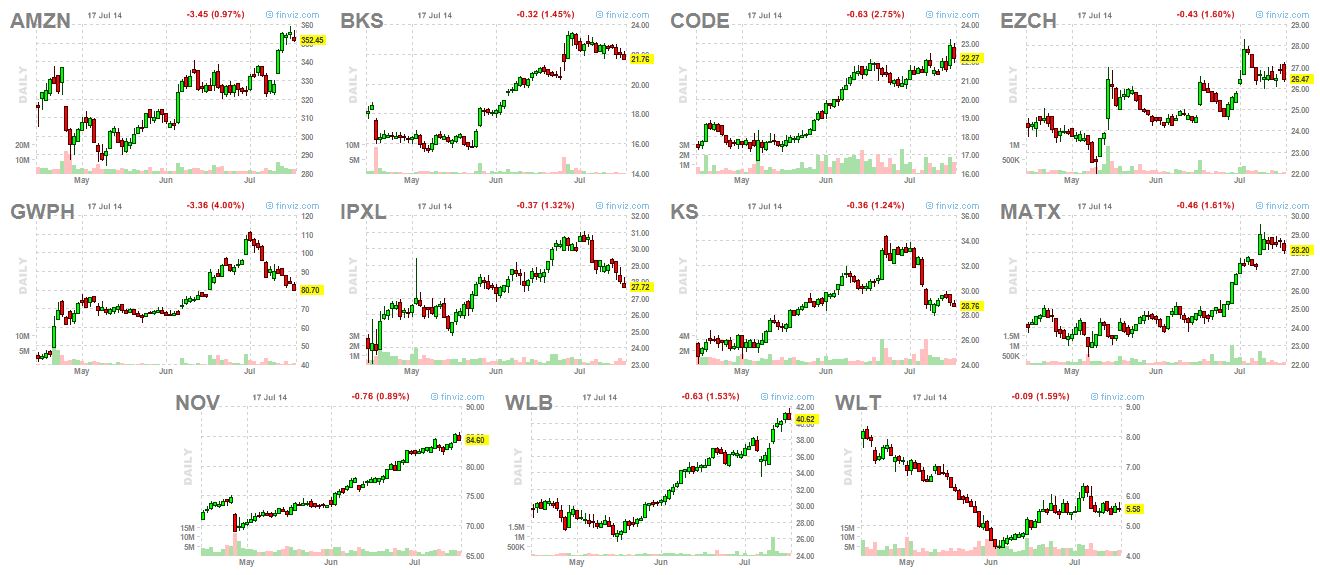
CODE has pulled back and still looks good. I would allow for a deeper pullback due to market conditions. Same goes for BKS. EZCH is still holding support. MATX is still a nice breakout setup, but with market conditions I would wait for a pullback into the gap fill area to increase the reward to risk ratio. GWPH is right at a key support level at $80. If that breaks it would become a good oversold bounce setup in the low to mid 70s.
Note that KS is a short setup–but not near entry right now.
New Additions:
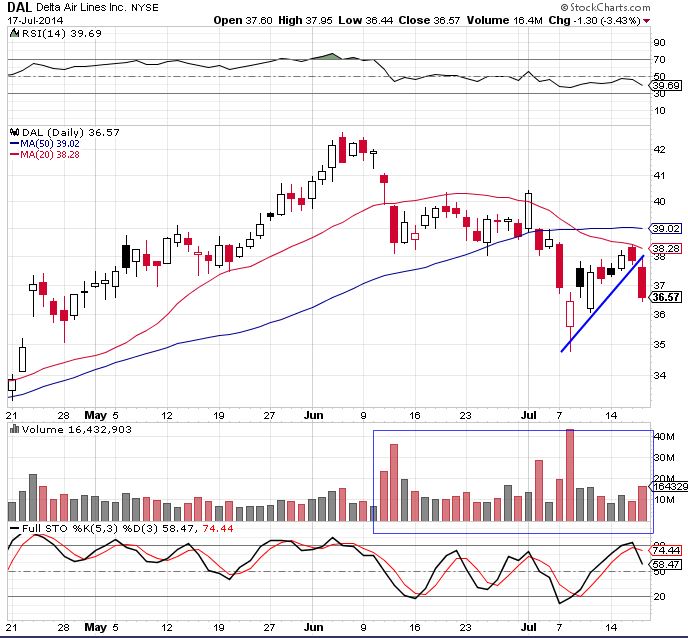
We’ve had DAL on our shorts watchlist recently, and today it broke down off a textbook breakdown-pullback setup. I would like to short it on strength.
All of the stocks in the shorts category below are in the midst of forming nice setups. I am watching them closely.
Here are the categories we started watching during last week’s pullback. Click on stocks for charts.
1) get extremely oversold and near major support for bounces (rubber band setup) I am not just looking for oversold readings here, I am looking for extremes. We are not there yet on most of these. There needs to be more selling, price nearing important support levels, and extreme readings. At that point we increase the probability of a bounce. If SPY can pullback to the 50 dma (see chart below), a bunch of these will setup. GWPH, IPXL, KS, EZCH, Z, TWTR, YY, Z, TSLA
2) stocks and sectors that are holding up well (possible rotation or new leaders) Energy, metals, gold, silver, apparel BKS, FANG, PTRY, BWLD, CTRN, TAP, CODE, GMCR, X, FCX, XOM, COP, CZRO, NOV, CLR, AA, MATX
3) stocks that reverse off big down days intraday (hammers) UAL, LUV, JBLU
4) Select shorts AAPL, AKAM, KS, SDRL, GRMN, MSM, SDRL (GOOGL removed)
5) Pullback shorts (bounce to resistance after big drop–often was a rubber band trade) We need to wait and see for this list. Many will come from the stocks that bounce after extreme drops. Big Drop – – -> bounce – – -> short setup if bounce on weak volume and price action
Market Leaders
These are stocks that I always watch, though they might not be in my tradeable watchlist, nor are they actually always leading the market.
I was actually rather impressed with how our market leaders held up. Usually big momo stocks like these get hit very hard. We did not have any technical breakdowns. I actually would have liked to see a few to get some rubber band (oversold bounce) plays in motion. Right now I am targeting TSLA at 200, AMZN at 330, NFLX at 400, FB at 62, GOOG around $560 and Z at 110. We likely only hit these numbers if SPY pulls back near the 50 dma. If it does, it wouldn’t be until next week.

Please read the post 23 Laws of the Part Time Swing Trading the Market Speculator Way. It is important to know these rules if you trade off the Report.
New subscribers and trial members please leave me any feedback/comments in the comments, via email (singhjd1@aol.com) or twitter (twitter.com/PaulJSingh).
