As traders if we stop learning, we die.
Okay I’m being dramatic, but at the least our accounts die.
It was Henry Ford who famously said “anyone who stops learning is old, whether at twenty or eighty”, and I could not agree more. It is for this reason that I take the last couple of weeks of every year to reflect on the trading year and journal the most important lessons that will impact my future.
The year 2018 is a gold mine of trading lessons, mostly because we were gifted a bear market the likes of which we have not seen in years. Many of you have never experienced a bear market, and those of us who have had to brush up on our bear market notes (thank goodness for my old journals!).
I say gift because if you knew what to do, as our Trade Report members did, you crushed the market.
Most everybody else were losers. Even the pros. The average equity hedge fund is down 4% this year, as reported by Goldman Sachs.
Compare that to the Swing Trade Alert Stats.
Mostly due to the strategy adjustments I discuss below, Trade Alerts were up 33% in 2018. Included below is a snap of the last 14 trades (I will do a public webinar soon covering the entire year’s results).

Even better, Trade Report members crushed the market both using alerts and more importantly (because I prefer traders make their own trades rather than blindly following alerts) listening to the daily analysis Report videos that laid out the lessons you will read about below.
Last week I asked Members to send me results, and not one member reported not outperforming the market. Even better, in a market where hedge funds are red, not one member reported being red on the year (although I suspect there are a few who did not send results).
So now you know these lessons don’t come from just keeping pace or beating the market, they come from crushing the market.
Take note of these lessons and let them guide you heading into 2019.
The 11 Trading Lessons Learned in 2018
Let Market Breadth Guide Your Trading
There are always people in the know. These mysterious people (not really) know what’s coming ahead of time and make moves before everybody else. If the markets about to crash, they position themselves accordingly and do their best to keep what they are doing a secret.
However, as hard as they try, they can not completely hide their tracks. Your job is to track the footprints that they unwittingly leave behind.
Think of yourself as the old Native American trackers, hunting down the footprints of a dangerous animal in the dead of a snowy winter. Like a tracker, you must understand the terrain. From there, you dig deeper and search for patterns, common behaviors, and other clues that signal a certain outcome.
For swing traders, the terrain is the market and the patterns and behaviors that lead us to likely outcomes can be found by analyzing market breadth. Report members know that our study of the market at this deeper level has kept us from getting hit hard in every big market meltdown since the service started in 2014.
This year was yet another example of the importance of market breadth. In the middle of September the market (SPY) was hitting all-time highs and most pundits were telling retail traders to load up on positions. However, we noticed some troubling signs.
I’ll point out two here:
- Small Caps were starting to decline and not hitting new highs.
- The T2108 indicator (which measures stocks above their 40 day moving averages) was also in decline way off highs.
Notice the “negative divergences” in the chart below. IWM and T2108 both peak and start trending down almost one month before SPY hits its all time high. This is not what you want to see in a strong market.
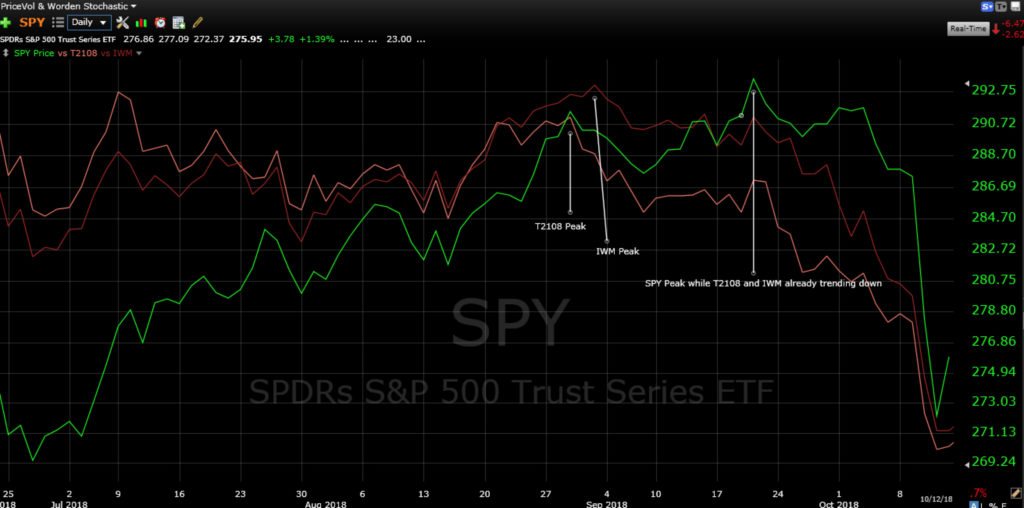
This analysis is what lead me to start trading very conservatively in mid September. Yes, we were at all-time highs. But as you can see, market internals were terrible, and predictive of a corrective market. While many others were caught over leveraged as the market began to tank in early October, we were in only one long position. This was a big change from just a few weeks earlier, when we are trading very aggressively.
We owe our trading success during this period to market breadth analysis.
The Character of the Market Shifts in Bear Markets
Technically, we only recently hit “bear market” levels since the standard definitions of a bear markets include 15% off highs or when 80% of stocks are in decline. However, we knew very early on the October pullback was not the healthy “profit taking in bull markets” pullback we’ve seen over the past 3 years. So whether we call it a “bear”, “corrective” or “fugly” market, there has been a definitive character shift from our multi-year uptrend.
How did the character of the market change? Let me count the ways:
Strong Opens are Faded in Bear Markets
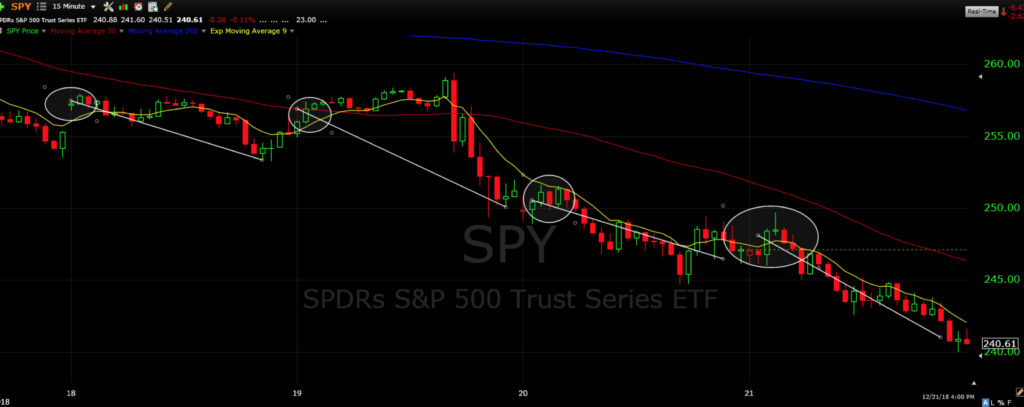
Take a look at this intraday 15-minute chart of the last 4 trading days. The market was getting crushed during this period. We are in full melt down mode.
Now notice how each day started, and where they ended (hint: ended lower).
Yes, the market opened in the morning with strength. The key difference between strong and weak markets is not how often we see morning strength, it’s whether or not that strength holds. In corrective markets, do not get caught in a “bull trap”. Only establish longs if morning strength holds. That is because in a corrective market, strong opens rarely ever hold.
Initial Bounces Become Dead Cat Bounces (instead of the start of another uptrend) in Bear Markets
In up-trending markets, bounces are joyous events because they signal the end of a temporary pullback. Once a bounce is in play, traders jump on and get ready to ride the next uptrend. That’s not the case in bear markets.
Bounces in bear markets cause a mix of emotions in a trader, otherwise known as indigestion. With a bottle of Tums in hand, the trader agonizes over whether this bounce is a “dead cat” bounce destined to fail, or the real deal that signals the end of the pullback. Now logically the trader knows she’s in a bear market and odds are the bounce fails, but FOMO (fear of missing out) sets in and she imagines all her trader friends ridiculing her if she misses the profits from the next bull market.
And she’s not the only one. Group think sets in and trader after trader starts to pile into this bounce, which ultimately fails. This is the classic “bear market bull trap”.
Don’t get caught in it. Remember, if it truly is a true bounce that leads to an uptrend, there will be plenty of profitable and safer spots to enter. You don’t need to be the Netscape of trading (for those too young to remember, they were the first “Explorer/Chrome/Safari”).
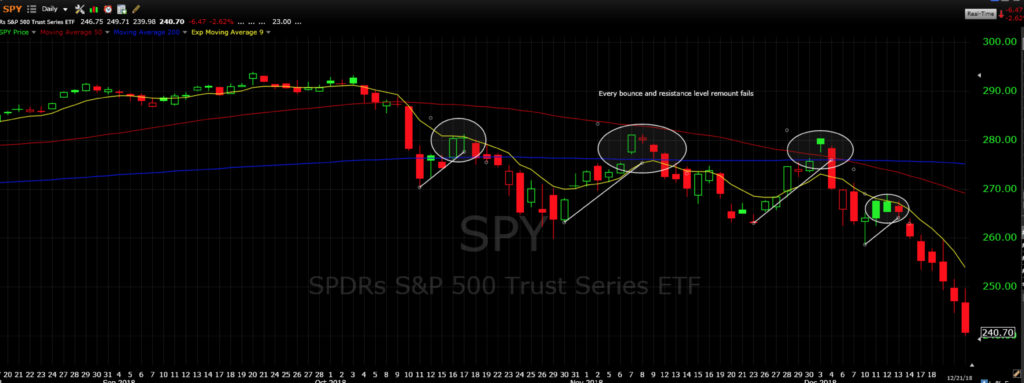
This chart shows how powerful a bear market is, and how treacherous it is trying to swing against it’s stream. Every bounce failed miserably and lead to a swift decline, with no uptrends in sight.
Remounts of Resistance Levels Fail in Bear Markets
The chart above also illustrates the next lesson. In bear markets, resistance level remounts fail. For those who need a quick primer, a resistance level remount is when price takes out over head resistance (like a moving average or old highs).
This corresponds closely with bounces, since a remount requires a bounce. The idea here is if above resistance is taken out, be patient and make sure the level holds.
Usually it won’t.
In this bear market, every “remount” entry, which is a bread and butter setup in up trending markets, failed.
Support Levels Do Not Provide Support in Bear Markets
Support levels are areas that provide a “floor” for a stock that prevent stocks from falling further. These “buy zones” are difficult to break because of price, moving average and trend line support. At these levels buyers come in and “support” the stock.
However, in bear markets there are no buyers to be found and price continues to crater. Price bounces once selling hits extreme “capitulation” or max fear levels, not necessarily at support levels.
In essence, there is no such thing as support in bear markets. Remember that. Watch support levels, but like the strategy with bounces, only enter to the long side once price proves itself in a secondary move.
Do not ever buy the first potential support bounce.
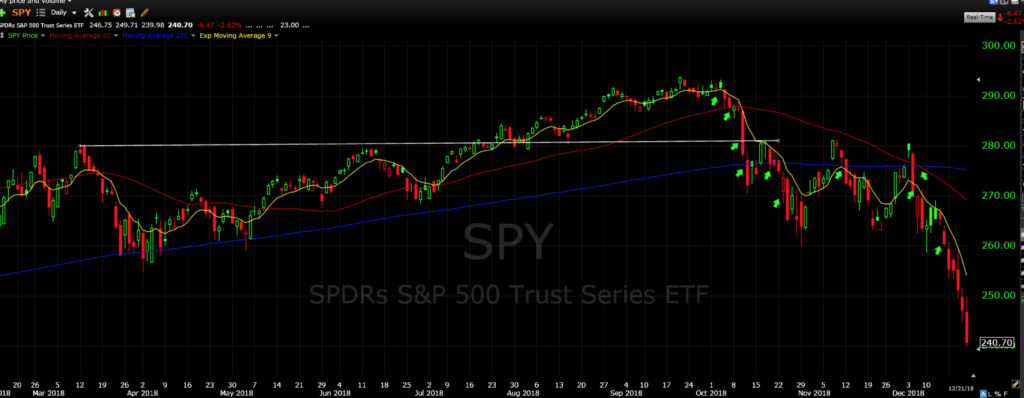
In the above chart, I have highlighted with arrows 10 different potential support levels that failed. In fact, I can only find one support level that provided a successful long trade. This is a great example of how dangerous it is to buy support in bear markets.
Positive Earnings and News Are “Sell the News” Events
Imagine bringing in a hard to get multi-million dollar client to your employer. Come bonus time, you expect a plaque on the wall and big money. Instead, you get a 20% reduction in your salary, with a warning that you might get fired.
Welcome to trading in a bear market.
In almost any market, stocks rise on good news. No surprise there. However, that’s not the case in bear markets. In bear markets, good news is ignored.
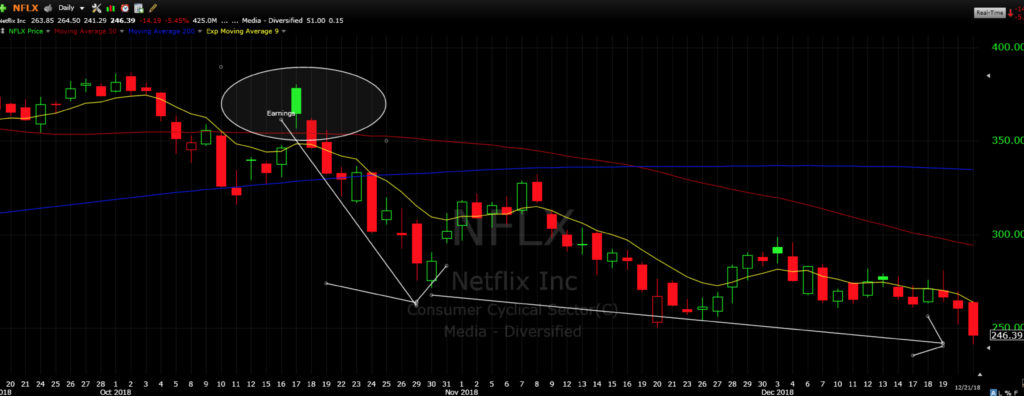
This year’s fourth quarter earnings is a great example of this phenomena. Every one of the FAANG stocks was crushed post earnings, even though only FB posted bad earnings. The other 4 all had good to great results. Yet, they all got crushed. Most notably was Netflix, which not only had good earnings, but gave investors a major upside surprise in subscriber growth.
This stock should have skyrocketed to the moon, but as the chart below shows, after an initial pop it was crushed.
In Bear Markets Go With Leveraged ETFs Instead of Stocks
Bull markets are a stock pickers dream come true. While just about anybody will make money in a bull market, those that pick the best momentum stocks will crush the market with outsized gains. For example, in 2017 you could trade just about anything and make money. However, if you traded stocks like NFLX or NVDA, you were looking at 100% gains.
Bear markets are a different animal. While you can make a lot shorting momentum stocks that are getting crushed, there often is no rhyme or reason for which ones get hit the hardest. More importantly, very few will make you more than going bearish with leveraged inverse index ETFs.
A leveraged ETF is one that increases the volatility of the underlying ETF. For example, if IWM is up or down 1%, leveraged ETF TNA is up or down close to 3%. An inverse ETF allows you to take a long trade but be bearish the index since it “flips” the movement of the underlying ETF. For example, if IWM is down 1%, inverse ETF is up 1%. Now if you use a leveraged inverse ETF like TZA, you are up 3%.
TZA has been my trading vehicle of choice in this bear market. Notice that while IWM is down around 30% off it’s highs, TZA is up around 100%. There are very few stocks that will give you this kind of gain.

Stick to the Plan in Every Market
Mike Tyson famously said everybody has a plan until they are punched in the face. Traders know this well. How many times have you formulated a great plan before entering a trade, only to ditch in the middle of a trade because you remember a past trade that crushed you on the first sign of trouble? My guess is you’ve done this at least once, and likely many times.
Traders must have a short memory, and not be beholden to every market movement. Especially swing traders. You see, there are very few trades that go up or down in a straight line. If you continually micro-management every tick, giving yourself small gains but never hitting the big one, you are destined to lose.
This is especially true in bear markets. Many big down moves include powerful bounces that fail. If you can’t stick to your initial target and stop levels, you will miss out on the big moves.
Take a look at the last 4 trade alerts.
Notice that we only have a 50% win rate, but the wins are much bigger than the losses leading to a $3700 gain. The biggest win was the TZA trade (the trading vehicle we just discussed above). That big win never happens if I had micro-managed the trade.

Winning Traders Know How to Handle Drawdowns
So far we have talked about the post summer bear market. Now let’s shift to the beginning of the year. While we have noted how handedly we beat the market this year, it did not start off great. I went through a tough drawdown in March and was actually down 4% on the year at one point.
It was tough, but I did not doubt myself for one second.
That’s because I’ve been through this rodeo many times, and understand the nature of trading. We are trading probabilities, and sometimes no matter how good we are trading we are on the wrong side of those probabilities.
Even the greatest traders of all time go through drawdowns. Drawdowns that are longer and more massive than anything you or I will experience. Study the greats like Warren Buffet, Jesse Livermore and Peter Lynch and you will be amazed at drawdowns that at times lasted years.
I have written and talked a lot on drawdowns in the past, but will touch on two quick points here.
- Analyze whether you are making mistakes or are just on the wrong side of luck. If you find mistakes, fix them.
- Understand that the drawdown will end so don’t let it cause you to trade irrationally by trading too aggressively or conservatively.
Trade With The Trend in All Markets
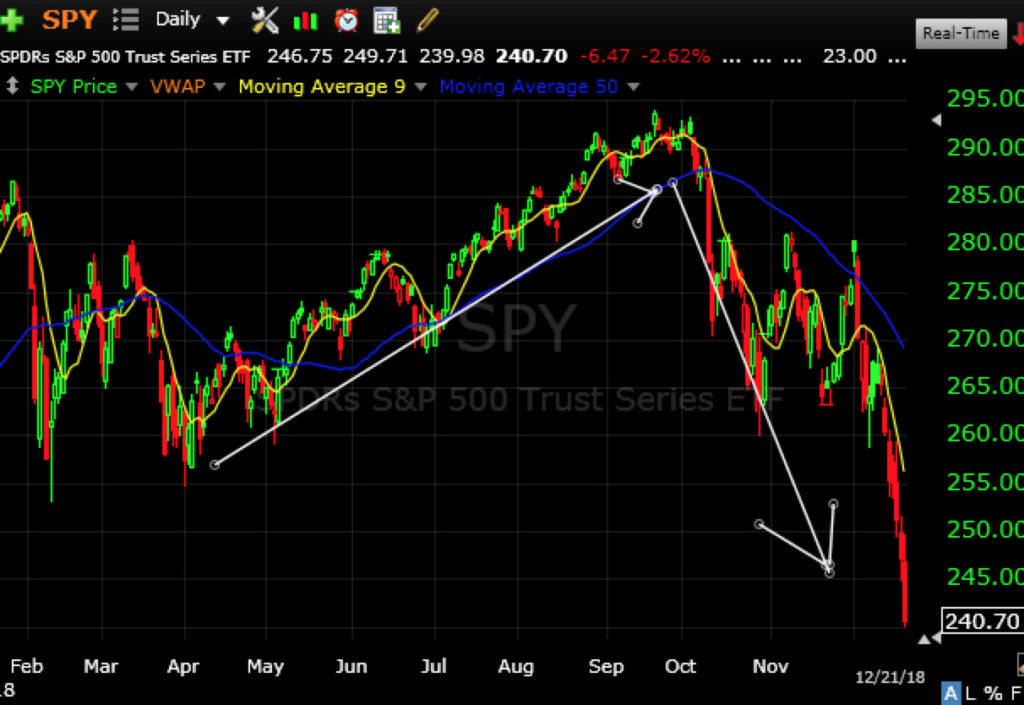
The easiest way to make money is to trade with the direction of the market. In 2018 this couldn’t be more true. In short, if you were long from April thru September, and in cash or short from October thru December, you not only made money this year, you crushed the market and wall street pros. That’s basically how we ended the year with a 40+ alpha (edge against the market).
The market makes up at least 50% of what your stock is going to do, often more. Understand the market trend, and you know what direction to take and now only need to find the best stocks. It’s that simple.
Conclusion
The degree of difficulty trading in 2018 was very high, but it was also a gift to those who applied the above trading lessons in real time. I suspect that the bear market is not over as we head into 2019. Keep these lessons next to you at all times and add them as tools in your trading repertoire.
Most importantly, continue learning. While these lessons are important, I guarantee 2019 will bring even more lessons and ample trading opportunites.
Swing Trade Service
This swing trading service is great for those that work and can’t monitor the computer all day. We have in-depth nightly reports on the gameplan for the day/week and all stock picks that I trade will be alerted and emailed to you.
Check out the Swing Service HERE
Follow me, Paul Singh AKA “TheMarketSpeculator” on Twitter or email me at SinghJD1@aol.com
11 Important Lessons Learned Swing Trading in 2018 (How We Mastered The Bear Market)
As traders if we stop learning, we die.
Okay I’m being dramatic, but at the least our accounts die.
It was Henry Ford who famously said “anyone who stops learning is old, whether at twenty or eighty”, and I could not agree more. It is for this reason that I take the last couple of weeks of every year to reflect on the trading year and journal the most important lessons that will impact my future.
The year 2018 is a gold mine of trading lessons, mostly because we were gifted a bear market the likes of which we have not seen in years. Many of you have never experienced a bear market, and those of us who have had to brush up on our bear market notes (thank goodness for my old journals!).
I say gift because if you knew what to do, as our Trade Report members did, you crushed the market.
Most everybody else were losers. Even the pros. The average equity hedge fund is down 4% this year, as reported by Goldman Sachs.
Compare that to the Swing Trade Alert Stats.
Mostly due to the strategy adjustments I discuss below, Trade Alerts were up 33% in 2018. Included below is a snap of the last 14 trades (I will do a public webinar soon covering the entire year’s results).
Even better, Trade Report members crushed the market both using alerts and more importantly (because I prefer traders make their own trades rather than blindly following alerts) listening to the daily analysis Report videos that laid out the lessons you will read about below.
Last week I asked Members to send me results, and not one member reported not outperforming the market. Even better, in a market where hedge funds are red, not one member reported being red on the year (although I suspect there are a few who did not send results).
So now you know these lessons don’t come from just keeping pace or beating the market, they come from crushing the market.
Take note of these lessons and let them guide you heading into 2019.
The 11 Trading Lessons Learned in 2018
Let Market Breadth Guide Your Trading
There are always people in the know. These mysterious people (not really) know what’s coming ahead of time and make moves before everybody else. If the markets about to crash, they position themselves accordingly and do their best to keep what they are doing a secret.
However, as hard as they try, they can not completely hide their tracks. Your job is to track the footprints that they unwittingly leave behind.
Think of yourself as the old Native American trackers, hunting down the footprints of a dangerous animal in the dead of a snowy winter. Like a tracker, you must understand the terrain. From there, you dig deeper and search for patterns, common behaviors, and other clues that signal a certain outcome.
For swing traders, the terrain is the market and the patterns and behaviors that lead us to likely outcomes can be found by analyzing market breadth. Report members know that our study of the market at this deeper level has kept us from getting hit hard in every big market meltdown since the service started in 2014.
This year was yet another example of the importance of market breadth. In the middle of September the market (SPY) was hitting all-time highs and most pundits were telling retail traders to load up on positions. However, we noticed some troubling signs.
I’ll point out two here:
Notice the “negative divergences” in the chart below. IWM and T2108 both peak and start trending down almost one month before SPY hits its all time high. This is not what you want to see in a strong market.
This analysis is what lead me to start trading very conservatively in mid September. Yes, we were at all-time highs. But as you can see, market internals were terrible, and predictive of a corrective market. While many others were caught over leveraged as the market began to tank in early October, we were in only one long position. This was a big change from just a few weeks earlier, when we are trading very aggressively.
We owe our trading success during this period to market breadth analysis.
The Character of the Market Shifts in Bear Markets
Technically, we only recently hit “bear market” levels since the standard definitions of a bear markets include 15% off highs or when 80% of stocks are in decline. However, we knew very early on the October pullback was not the healthy “profit taking in bull markets” pullback we’ve seen over the past 3 years. So whether we call it a “bear”, “corrective” or “fugly” market, there has been a definitive character shift from our multi-year uptrend.
How did the character of the market change? Let me count the ways:
Strong Opens are Faded in Bear Markets
Take a look at this intraday 15-minute chart of the last 4 trading days. The market was getting crushed during this period. We are in full melt down mode.
Now notice how each day started, and where they ended (hint: ended lower).
Yes, the market opened in the morning with strength. The key difference between strong and weak markets is not how often we see morning strength, it’s whether or not that strength holds. In corrective markets, do not get caught in a “bull trap”. Only establish longs if morning strength holds. That is because in a corrective market, strong opens rarely ever hold.
Initial Bounces Become Dead Cat Bounces (instead of the start of another uptrend) in Bear Markets
In up-trending markets, bounces are joyous events because they signal the end of a temporary pullback. Once a bounce is in play, traders jump on and get ready to ride the next uptrend. That’s not the case in bear markets.
Bounces in bear markets cause a mix of emotions in a trader, otherwise known as indigestion. With a bottle of Tums in hand, the trader agonizes over whether this bounce is a “dead cat” bounce destined to fail, or the real deal that signals the end of the pullback. Now logically the trader knows she’s in a bear market and odds are the bounce fails, but FOMO (fear of missing out) sets in and she imagines all her trader friends ridiculing her if she misses the profits from the next bull market.
And she’s not the only one. Group think sets in and trader after trader starts to pile into this bounce, which ultimately fails. This is the classic “bear market bull trap”.
Don’t get caught in it. Remember, if it truly is a true bounce that leads to an uptrend, there will be plenty of profitable and safer spots to enter. You don’t need to be the Netscape of trading (for those too young to remember, they were the first “Explorer/Chrome/Safari”).
This chart shows how powerful a bear market is, and how treacherous it is trying to swing against it’s stream. Every bounce failed miserably and lead to a swift decline, with no uptrends in sight.
Remounts of Resistance Levels Fail in Bear Markets
The chart above also illustrates the next lesson. In bear markets, resistance level remounts fail. For those who need a quick primer, a resistance level remount is when price takes out over head resistance (like a moving average or old highs).
This corresponds closely with bounces, since a remount requires a bounce. The idea here is if above resistance is taken out, be patient and make sure the level holds.
Usually it won’t.
In this bear market, every “remount” entry, which is a bread and butter setup in up trending markets, failed.
Support Levels Do Not Provide Support in Bear Markets
Support levels are areas that provide a “floor” for a stock that prevent stocks from falling further. These “buy zones” are difficult to break because of price, moving average and trend line support. At these levels buyers come in and “support” the stock.
However, in bear markets there are no buyers to be found and price continues to crater. Price bounces once selling hits extreme “capitulation” or max fear levels, not necessarily at support levels.
In essence, there is no such thing as support in bear markets. Remember that. Watch support levels, but like the strategy with bounces, only enter to the long side once price proves itself in a secondary move.
Do not ever buy the first potential support bounce.
In the above chart, I have highlighted with arrows 10 different potential support levels that failed. In fact, I can only find one support level that provided a successful long trade. This is a great example of how dangerous it is to buy support in bear markets.
Positive Earnings and News Are “Sell the News” Events
Imagine bringing in a hard to get multi-million dollar client to your employer. Come bonus time, you expect a plaque on the wall and big money. Instead, you get a 20% reduction in your salary, with a warning that you might get fired.
Welcome to trading in a bear market.
In almost any market, stocks rise on good news. No surprise there. However, that’s not the case in bear markets. In bear markets, good news is ignored.
This year’s fourth quarter earnings is a great example of this phenomena. Every one of the FAANG stocks was crushed post earnings, even though only FB posted bad earnings. The other 4 all had good to great results. Yet, they all got crushed. Most notably was Netflix, which not only had good earnings, but gave investors a major upside surprise in subscriber growth.
This stock should have skyrocketed to the moon, but as the chart below shows, after an initial pop it was crushed.
In Bear Markets Go With Leveraged ETFs Instead of Stocks
Bull markets are a stock pickers dream come true. While just about anybody will make money in a bull market, those that pick the best momentum stocks will crush the market with outsized gains. For example, in 2017 you could trade just about anything and make money. However, if you traded stocks like NFLX or NVDA, you were looking at 100% gains.
Bear markets are a different animal. While you can make a lot shorting momentum stocks that are getting crushed, there often is no rhyme or reason for which ones get hit the hardest. More importantly, very few will make you more than going bearish with leveraged inverse index ETFs.
A leveraged ETF is one that increases the volatility of the underlying ETF. For example, if IWM is up or down 1%, leveraged ETF TNA is up or down close to 3%. An inverse ETF allows you to take a long trade but be bearish the index since it “flips” the movement of the underlying ETF. For example, if IWM is down 1%, inverse ETF is up 1%. Now if you use a leveraged inverse ETF like TZA, you are up 3%.
TZA has been my trading vehicle of choice in this bear market. Notice that while IWM is down around 30% off it’s highs, TZA is up around 100%. There are very few stocks that will give you this kind of gain.
Stick to the Plan in Every Market
Mike Tyson famously said everybody has a plan until they are punched in the face. Traders know this well. How many times have you formulated a great plan before entering a trade, only to ditch in the middle of a trade because you remember a past trade that crushed you on the first sign of trouble? My guess is you’ve done this at least once, and likely many times.
Traders must have a short memory, and not be beholden to every market movement. Especially swing traders. You see, there are very few trades that go up or down in a straight line. If you continually micro-management every tick, giving yourself small gains but never hitting the big one, you are destined to lose.
This is especially true in bear markets. Many big down moves include powerful bounces that fail. If you can’t stick to your initial target and stop levels, you will miss out on the big moves.
Take a look at the last 4 trade alerts.
Notice that we only have a 50% win rate, but the wins are much bigger than the losses leading to a $3700 gain. The biggest win was the TZA trade (the trading vehicle we just discussed above). That big win never happens if I had micro-managed the trade.
Winning Traders Know How to Handle Drawdowns
So far we have talked about the post summer bear market. Now let’s shift to the beginning of the year. While we have noted how handedly we beat the market this year, it did not start off great. I went through a tough drawdown in March and was actually down 4% on the year at one point.
It was tough, but I did not doubt myself for one second.
That’s because I’ve been through this rodeo many times, and understand the nature of trading. We are trading probabilities, and sometimes no matter how good we are trading we are on the wrong side of those probabilities.
Even the greatest traders of all time go through drawdowns. Drawdowns that are longer and more massive than anything you or I will experience. Study the greats like Warren Buffet, Jesse Livermore and Peter Lynch and you will be amazed at drawdowns that at times lasted years.
I have written and talked a lot on drawdowns in the past, but will touch on two quick points here.
Trade With The Trend in All Markets
The easiest way to make money is to trade with the direction of the market. In 2018 this couldn’t be more true. In short, if you were long from April thru September, and in cash or short from October thru December, you not only made money this year, you crushed the market and wall street pros. That’s basically how we ended the year with a 40+ alpha (edge against the market).
The market makes up at least 50% of what your stock is going to do, often more. Understand the market trend, and you know what direction to take and now only need to find the best stocks. It’s that simple.
Conclusion
The degree of difficulty trading in 2018 was very high, but it was also a gift to those who applied the above trading lessons in real time. I suspect that the bear market is not over as we head into 2019. Keep these lessons next to you at all times and add them as tools in your trading repertoire.
Most importantly, continue learning. While these lessons are important, I guarantee 2019 will bring even more lessons and ample trading opportunites.
Swing Trade Service
This swing trading service is great for those that work and can’t monitor the computer all day. We have in-depth nightly reports on the gameplan for the day/week and all stock picks that I trade will be alerted and emailed to you.
Check out the Swing Service HERE
Follow me, Paul Singh AKA “TheMarketSpeculator” on Twitter or email me at SinghJD1@aol.com
Share:
Stock & Option Software used by Bulls on Wallstreet
Social Media
Related Posts
Market Speculator Part-Time | Swing Trade Report
Trade Alert: NFLX
Trading Watch List 02.03.2025
Market Speculator Part-Time | Swing Trade Report
Stop Guessing.
Start Trading.
Don’t Miss Out
Pre-Market Live-stream
Tuesday’s and Thursday’s at
9:00 AM EST.