

The Pre-Trade Checklist: 5 Questions Every Trader Must Ask Before Entering Any Trade
Most traders never ask themselves the single question that separates professionals from account-breakers:
Do I have a trade, or do I just have hope?
You see a stock moving. Your friends are talking about it. Social media is buzzing. The dopamine hits. You buy. Three minutes later you’re down money with no exit plan and your stomach’s in your throat. Sound familiar?
I’ve been trading since 1999. I’ve been full-time since 2007. I founded Bulls on Wall Street in 2008 and trained over 7,000 students through our bootcamp. And I’m telling you with absolute certainty: The difference between profitable traders and broke ones isn’t luck, intelligence, or access to special information. It’s this: Professional traders run through a checklist before every single trade. Amateurs skip it and pay for it.
No pattern. No trade.
That’s not a suggestion. That’s a law. And I’ve built my entire 25+ year trading career around it.
Why Most Traders Skip the Checklist (And Why That Kills Accounts)
Before I show you the system, let’s talk about why you’re tempted to skip it.
The FOMO Problem is Real and Daily
Your brain is engineered for speed. When you see a stock ripping upward or consolidating before a breakout, your nervous system triggers fight-or-flight. Missing out feels dangerous. Your trading account could have 10 consecutive wins, but the one trade you skip that goes 50% will haunt you for weeks.
This is FOMO at work, and it’s the silent killer of trading accounts. It causes traders to buy without recognizing a pattern, chase parabolic moves at the absolute worst entries, risk entire accounts on hot tips from Twitter, and ignore their own rules because this time feels different.

Let me tell you about one of my students. His name is Danny.
Danny has been asking me about Tesla for years. Years. Every pullback, every consolidation, he’s asking if it’s time to buy. He took a long break from trading after losing money chasing wicks and getting smoked in late 2024. I told him to use that time to study. He did. By December 2025, he wanted back in.
His first question when he returned: Should I buy Tesla?
I checked the chart. Tesla was extended. The market was topping. I told him — Chill out. It’s not a setup.
But then Tesla ripped to $500. Consolidated. Danny watched it consolidate for a week. His FOMO kicked in. He saw the move. He thought he’d missed it. So he went all-in on Tesla calls in the $490s. Not a partial position. Nearly his entire account.
That was the top.
Every single day after that, Tesla declined. Danny bled out. Losing money on losing positions every morning before the market even properly opened. The stress. The calls with me. The regret.
You know what Danny does now? He disappears. He’ll be silent for 6 months while the market bases out. He doesn’t want to look at charts or talk trading because he’s licking his wounds. But the moment the market starts trending again and the tail end of a run is happening, his FOMO kicks in again. He checks back. He asks to buy Tesla again or whatever’s running. And he’s already late to the move.
I see this pattern repeat with Danny every single market cycle. The FOMO gets him every time. When the market is crap and things are basing out, he doesn’t want any part. Then when trends finally emerge, his brain forces him to chase the end of the move.
Don’t be Danny.
Why This Happens to Everyone
The checklist isn’t just about filtering setups. It’s about filtering your own psychology. When you have objective rules written down, you don’t have to think. You don’t have to feel. You just check boxes.
The 5-Point Pre-Trade Checklist: Your Trading Constitution
Where This Checklist Came From
Early in my career, a mentor told me something that changed how I teach: Pilots don’t fly planes from memory. They use checklists. Every single flight. Even after 10,000 hours.
I had been trading profitably for years at that point. I had internalized my process — it was second nature. But when I started BOWS in 2008 and had to teach other people how to trade, I realized the problem: you can not teach intuition. You can not hand someone 7 years of screen time and say — here, use this.
So I reverse-engineered my own decision-making. Every time I entered a trade, I asked myself: What am I actually checking before I pull the trigger? I wrote it down. I condensed years of internalized processes into checklists — checklists for entries, checklists for stop losses, checklists for evaluating whether a stock is even worth watching.
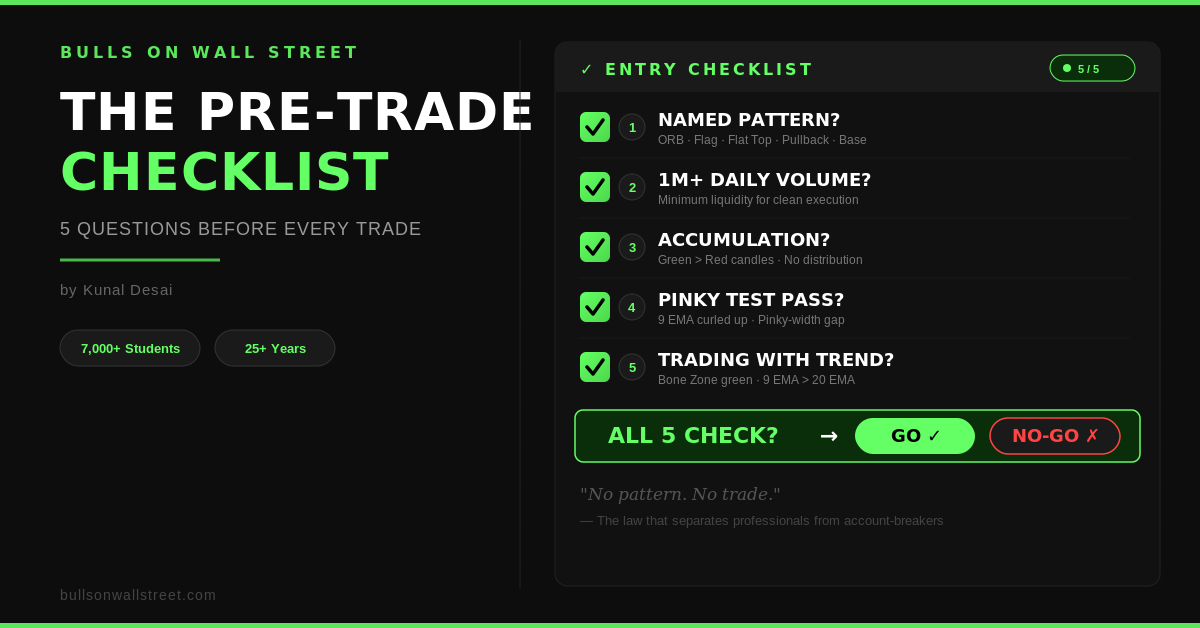
The 5-point system below is the entry checklist. Bootcamp students work off this checklist to this day. It is the single most important document in the entire BOWS curriculum. Print it. Laminate it. Tape it to your monitor.
Run through these five questions before entering ANY trade. Each one filters out chaos. Each one keeps you disciplined. All five must check. If even one fails, you don’t have a trade.

Point 1: Do I Have a Named Price Pattern?
Non-negotiable: If you can’t name the pattern, there’s no trade.
The stock cannot look promising. It cannot feel like it’s about to move. It must have a name. A recognized pattern with defined entry rules, stop-loss placement, and exit levels.
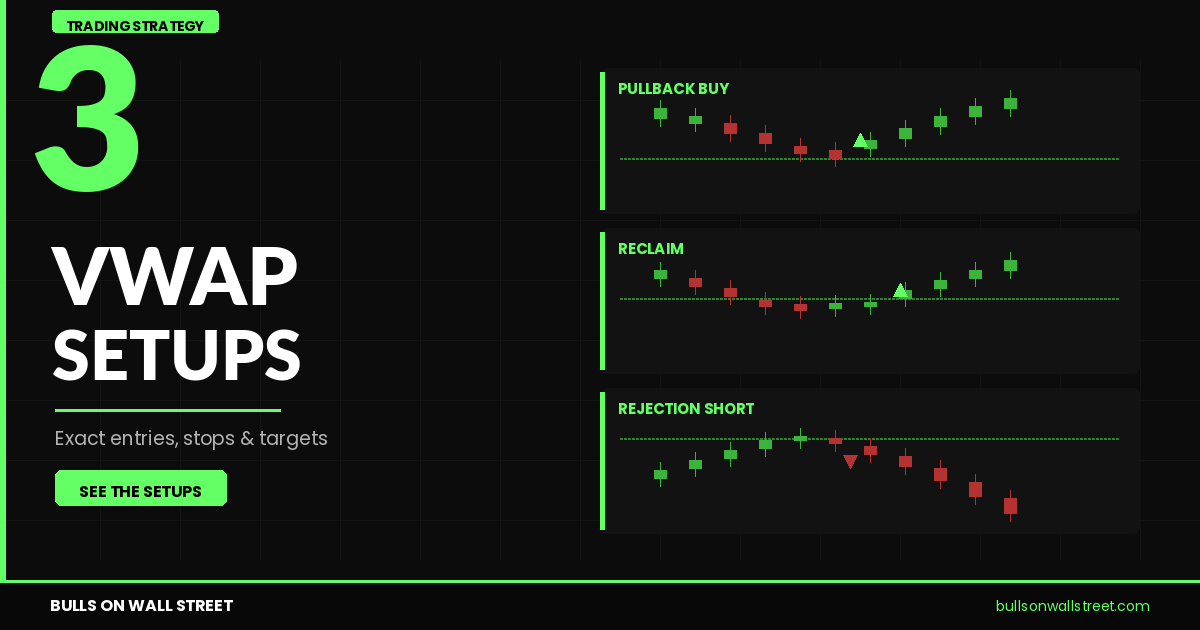
Here are the patterns that work:
If your setup is none of these? Skip it. You’re guessing, and guessing loses money.

Why This Actually Works:
A named pattern has rules. Rules mean you know exactly where to place your stop. You know where to take profits. You know your risk before you risk anything. A stock that just looks good to you has none of that. You’ll panic-exit because there’s no objective measurement. Or you’ll hold too long hoping it works.
Pattern recognition isn’t magic. It’s discipline.
Point 2: Is There Liquidity?
The rule: Minimum 1 million shares traded per day. No exceptions.
A stock with low volume will trap you. You get a great entry but can’t exit when you need to. Your stop-loss ghosts you. Your profit target never fills. Low volume equals high slippage. Small wins disappear in execution nightmares.
How to Check: Look at the last 5 days of volume on your charting platform. Average them. Is it 1M+ shares daily?

You technically can trade illiquid stocks if:
1. Your position size is tiny ($50 risk instead of $300)
2. You’re holding for weeks, not minutes
3. The pattern is extremely tight and obvious
For 99% of traders, 1M daily volume is the absolute minimum. It protects you from yourself.
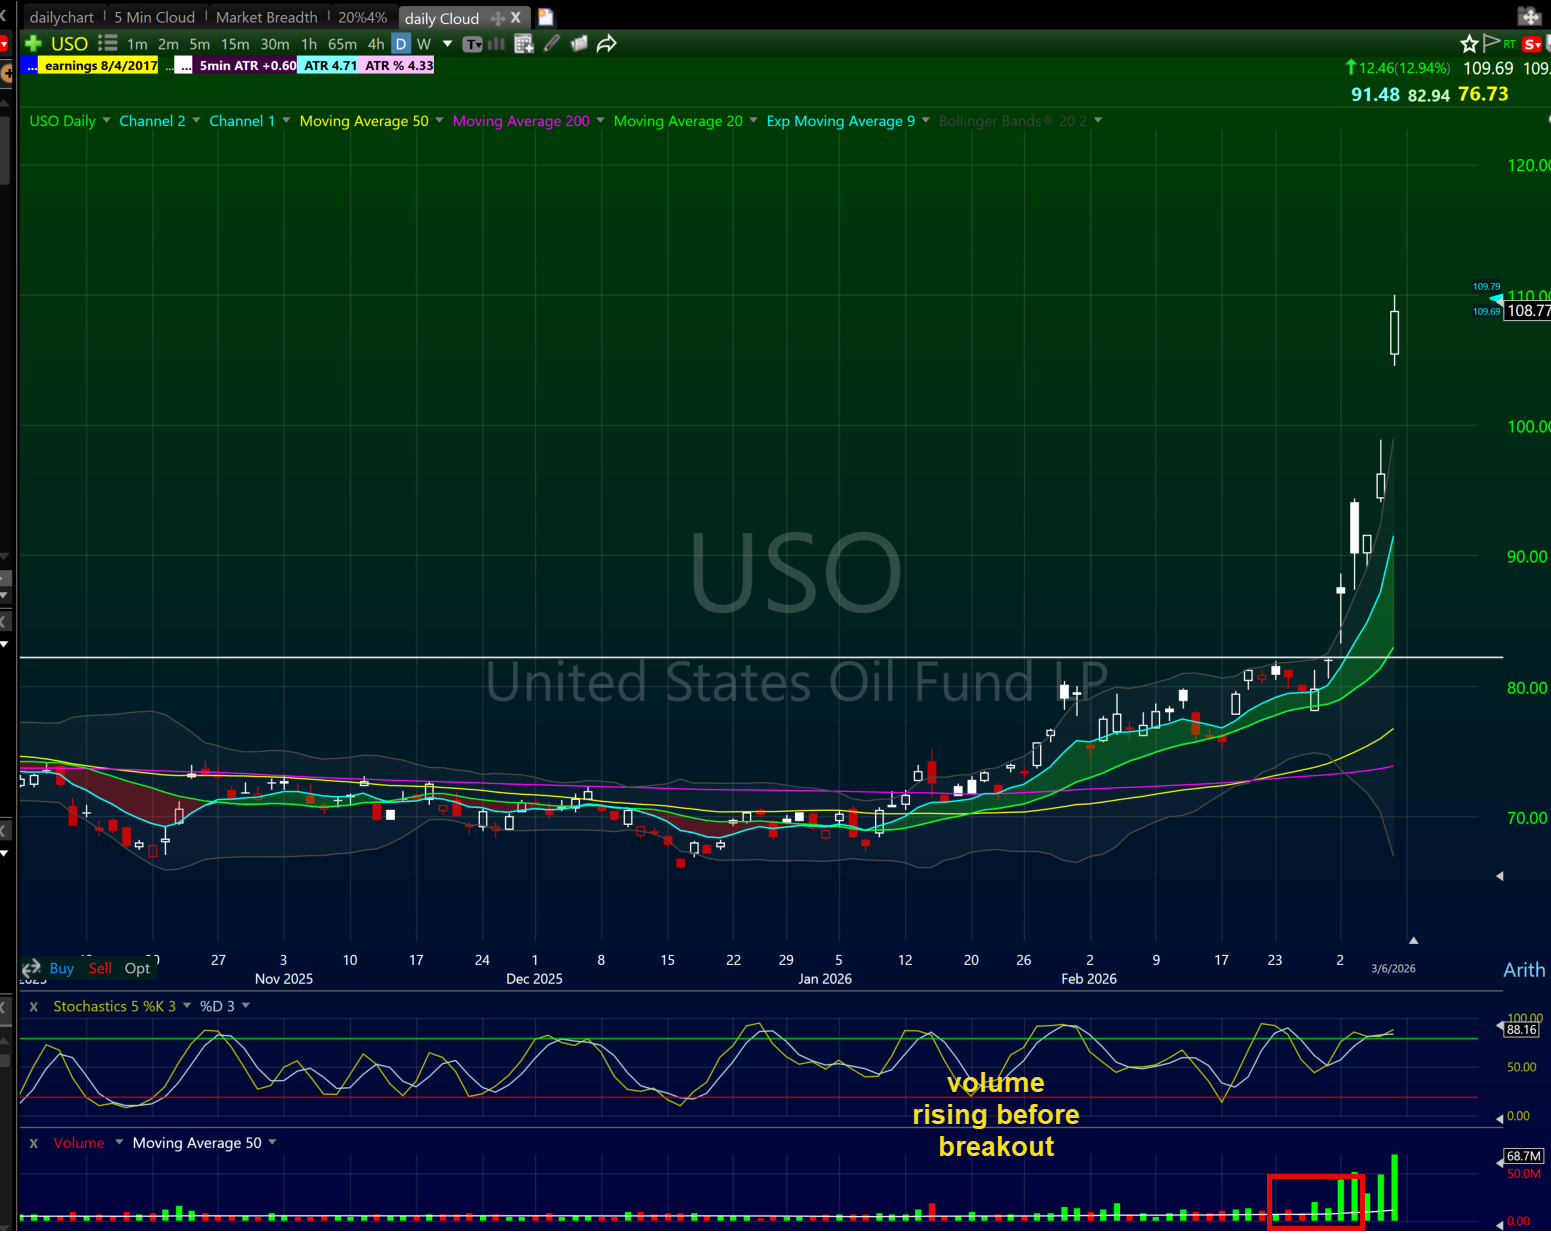
Point 3: No Distribution Before the Breakout?
The rule: Look at the 5 business days BEFORE your entry. Are red candles bigger than green candles?
Distribution is when large sells overwhelm buys. It shows smart money is exiting while retail (you) is thinking about entering.
Real Example of What This Looks Like:
Stock is consolidating around $50. You’re thinking about buying the breakout. Pull up the daily chart. Look at the 5 candles before the breakout:
This is accumulation. Green bigger than red. Buyers dominated. Buy the breakout.
Now flip the scenario:
This is distribution. Red bigger than green. Sellers dominated. Skip it entirely.

Why It Works: Distribution tells the story of consolidation. If sellers are beating buyers during the setup, the breakout will be a fizzle, not an explosion.
Point 4: Do My Moving Averages Support the Play? (The Pinky Test)
The rule: The 9 EMA must be curled up. It must be directly underneath the consolidation. And it must pass the pinky test.

Now Let Me Tell You Where the Pinky Test Came From
When I first started teaching in the BOWS bootcamp, students kept asking me the same question: How much space is too much space between price and the 9 EMA?
But here’s the problem: There is no set percentage. Bank of America moving 3% off the 9 EMA is probably extended because BofA doesn’t move much. SNDK moving 3% off the 9 EMA is NOT extended because SNDK moves 20% in a single day. Every stock has its own ATR.
One day I told my aunt: Use your pinky. Put your pinky finger between the 9 EMA line and the current price. If you can fit your pinky between them, the pattern is probably good. If you need your whole hand, it’s too loose.
It stuck. It became the pinky test. And now 7,000+ students use it because it’s simple and it actually works.
The Bone Zone Bonus:
Advanced traders also look at the space between the 9 EMA and 20 EMA, called the bone zone. The moving averages show momentum and direction.
Point 5: Am I Trading With the Trend?
The rule: Check the bone zone color. Green = uptrend (buy longs). Red = downtrend (short setups).

Why Trends Matter More Than You Think:
A setup aligned with the trend has 60-70% win rate. The same exact setup against the trend has 30-40% win rate.

The Bonus 6th Point: Is the Juice Worth the Squeeze?
The rule: Can your reward cover 3x your risk or better?
The first five points filter for quality setup. The sixth point filters for quality reward-to-risk.
Why This Determines Everything:
A 60% win rate on bad risk-reward trades still loses money over 100 trades. A 40% win rate on excellent risk-reward trades prints money.
The Real Story: When Chasing Costs You Everything (AAOI)
Let me tell you what happens when you know the rules but ignore them.
AAOI (Applied Optoelectronics) on a Friday morning did an Opening Range Breakout at $102.50. It ripped to $115. I missed the entire trade.
But then it hits $114. I gave in. I bought a dip around $113.50. Within 10 minutes, I had to sell for a 30-cent loss.
AAOI has an ATR (Average True Range) of $13.25. That morning, it had already used $17 of ATR. When a stock uses up its entire ATR without fresh news, the top is almost always in.
Red Flags: When to Skip Even if 4 Out of 5 Check
Even if a stock passes most checklist points, these red flags kill trades:
1. Three Big Green Days Before Breakout
If the stock already ripped 3 large green candles leading into consolidation, the move is already extended. Skip it.
2. Pattern Too Loose (Fails the Pinky Test)
3. Less Than 1M Daily Volume
4. Taking Breakouts in Wrong Market Condition
5. Stock Extended More Than a Pinky from 9 EMA
Position Sizing: Why You Can’t Just Risk 5% Per Trade
All the checklist work fails if you blow up your account on a single trade. Position sizing keeps you alive.
The formula:
Position Size = (Account Size × Risk %) / (Entry Price - Stop Price)
Example: $30,000 account. You risk 1% per trade ($300). Entry at $50, stop at $49.50.
Position Size = ($30,000 × 0.01) / ($50 - $49.50)
Position Size = $300 / $0.50 = 600 shares
Check out our Position Sizing Calculator.
Why Your Confidence Comes From Your Preparation
Your confidence in trading doesn’t come from ego. It comes from your competence. And competence comes from preparation.
When you run scans on TC2000 every single night, you deserve the wins because you put in the work. When you study 100,000 charts, you’ve trained your neural pathways to recognize patterns in real-time.
Building the Habit: How to Actually Use This System
Step 1: Print the Checklist
Step 2: Run It Before Every Trade
Step 3: Track Your Compliance
Step 4: Use TC2000 for Scanning
TC2000 is my platform of choice.
Step 5: Study Your Failures
Step 6: Physical Habits Prevent Overtrading
Frequently Asked Questions
Q: What if a stock doesn’t have a clear pattern but looks ready to move?
A: Skip it. Patterns are objective.
Q: Can I use this checklist for day trading and swing trading?
A: Yes. Works across all timeframes.
Q: What if the stock passes 4 out of 5 points?
A: Don’t trade it. All 5 must check.
Q: How do I know if my stop-loss is in the right place?
A: It should be under the 9 EMA for most breakout entries. Under the lowest candle of the consolidation for ORB entries.
Q: What’s the minimum liquidity I should trade?
A: 1M shares daily is the minimum.
Q: Should I take trades with only 2:1 reward-to-risk?
A: No. Wait for 3:1 or better.
Q: Can I trade stocks without a 9 EMA curl-up?
A: Technically yes, but your win rate drops to 40-45%.
Q: What if I miss the breakout because I was running the checklist?
A: You didn’t miss anything. The stock will pull back. You’ll buy the pullback to the 9 EMA with an even tighter entry.
Q: How long should I hold a position after entering?
A: Depends on the setup. Flat-top breakout: 3-10 days. Flag: 2-5 days. Pullback trade: 1-3 days.
Q: What do I do if I violate the checklist and enter anyway?
A: Cut the position immediately. Don’t average down.
Q: Can beginners use this checklist?
A: Yes. Master the core 5 points first before attempting the bonus 6th point.
Q: How many trades per week should I expect?
A: 1-3 excellent trades per week is realistic.
How to Train Your Pattern Recognition Fast
Your 30-Day Training Plan:
Week 1: Print 50 historical charts. Go through each with the checklist.
Week 2-3: Move to live charts. Every morning, scan 20-30 charts using TC2000. Run the checklist on each.
Week 4: Start paper trading.
Week 5+: Go live with 0.2% account risk.
Deepen Your Skills With These Resources
How to Trade Earnings Season — The complete playbook for navigating earnings announcements.
Candlestick Chart Patterns — Master the candlestick patterns that power every checklist decision.
The Bottom Line: Discipline Over Everything
The checklist isn’t fancy. It’s five simple questions that force discipline. Professional traders use checklists. Surgeons use checklists. Pilots use checklists.
Your confidence comes from your competence. Your competence comes from your preparation. And your preparation is this checklist, run every single day, no exceptions.
No pattern. No trade.
Ready to Master Professional Trading?
That’s why I created the 60-Day Live Trading Bootcamp.
Limited spots available each session.
External Resources
FINRA Investing Basics | SEC Investor.gov Guide
About the Author
Kunal Desai is the CEO and founder of Bulls on Wall Street. A professional trader since 2007, he has navigated every major market cycle—from the 2008 financial crisis to today’s high-volatility environments. Having mentored thousands of students through over 79 intensive trading bootcamps, Kunal is dedicated to teaching real-world execution and high-probability strategies. Based in Miramar Beach, Florida, he balances the intensity of the trading desk with a focus on fitness, family, and performance cars.
Connect with Kunal: Read his full story here | Instagram | YouTube
This strategy is part of our complete day trading strategies guide covering the setups professional traders use every single day.