In Day 12 of the 30 days to master part-time swing trading challenge we continue our discussion of volume, this time discussing how explosive volume propels breakouts.
What is a Breakout
We trade breakouts when a stock is moving outside of it’s current trading range, typically after price moves over a resistance level.
Swing traders love trading stocks once they clear trading ranges.
Stocks are stagnant when rangebound. While we do trade setups based on rangebound movements, stocks make the most money when they break trading ranges.
That’s because once a stock burst out of a range, volatility tends to increase and trends develop. Now the stock enters the “momentum phase”, which is where swing traders make the most money. While the breakout itself is a great trading setup, it’s also likely the start of a new momentum trend that can be traded.
Volume Impact on Breakouts
Now that the stock has cleared the trading range, it needs something to propel the stock.
Think of a paper airplane. You can throw it, and it will fly. However, soon the momentum from your throw will decrease and your plan will crash. The plan needs something to keep it going, like an engine.
For stocks, volume is that engine.
Increased volume tells us there is heightened interest in the stock. It also often tells us that the stock is backed with conviction by the big institutions, banks and hedge funds. These are the guys that can push the stock and create trends. We want to follow what these big players are doing
High Volume Breakout Pattern
Much like we want to see a stock’s price action break it’s trading range, we also want the same for volume.
Generally, I like to see at least two times the average daily volume on the day of a breakout. This signals new money pouring into the stock. After the breakout, we expect volume to decrease. Very few stocks sustain day one breakout volume.
However, while volume will decrease, we want to see a constant pattern of volume strength during up days versus down days. That means bigger green than red candles.
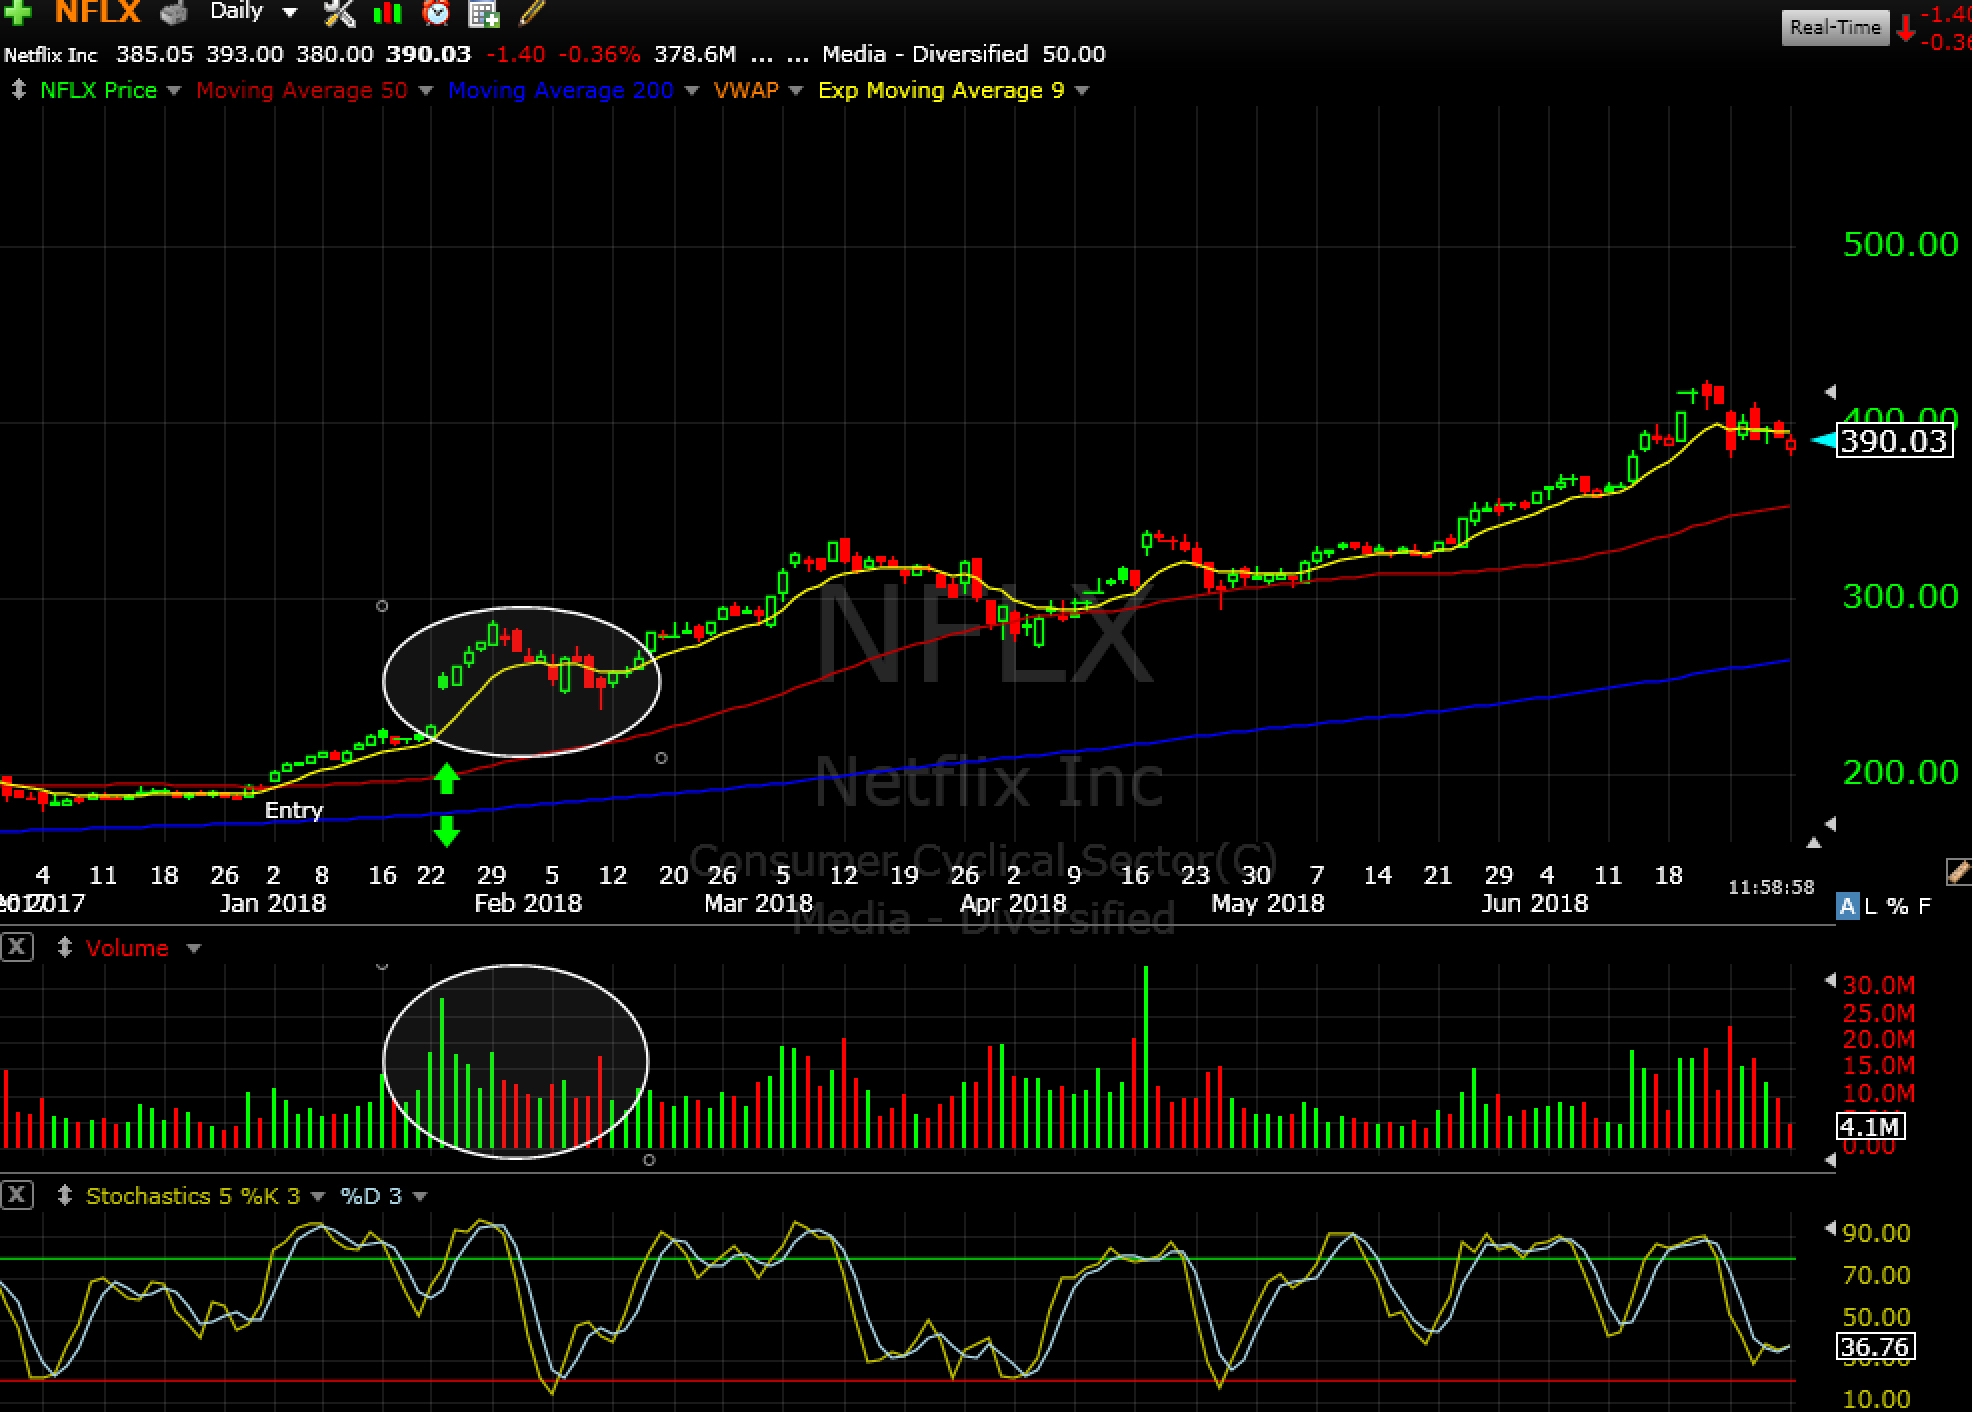
Let’s analyze the January Netflix breakout that started a huge momentum run in the stock. during a 5 month period, the stock ran from $227 to over $400.
This type of move rarely happens without a high volume breakout catalyst.
In the chart below, notice that the volume on the first breakout day was over 2X the average volume. As price floated higher post breakout and pulled back, upside (green) volume outpaces downside (red) volume. This is the exact type of volume pattern we want to see if we are looking for a bullish trend.
Consequently, the stock moved higher after pulling back.
If the volume pattern had shown distribution post breakout, or was not a high volume breakout, we would have expected a failed breakout or more range bound trading post breakout.
Now that you know what to look for watch today’s video and then do the exercise.
The Day 12 Exercise
- Pick 10 different types of stocks (the stocks you used in challenge 11 are fine)
- Go back 5 years and note over price action breakout
- Study the volume on the day of the breakout. Mark “high volume” if it broke out on 2X the over volume or more. Mark “low volume” on days it did not.
- Study the post breakout volume. Mark “accumulation” or “distribution” based on the pattern (review challenge 11 if you need more on accumulation/distrubition” patterns)
- Track which breakouts started trends and which did not.
Previous Posts
Day 1: Getting Started
Day 2: Analyze the Market
Day 3: How to Use Moving Averages
Day 4: Managing Risk and Setting Stops
Day 5: Managing Risk on a Macro Level
Day 6: Managing Risk and Taking PROFITS
Day 7: The Reward to Risk Ratio
Day 8: Stochatic Indicator
Day 9: Case Study Webinar Replay
Day 10: 5 Keys To Trading With Volume
Day 11: Volume and Accumulation Distribution
Swing Trade Service
This swing trading service is great for those that work and can’t monitor the computer all day. We have in-depth nightly reports on the gameplan for the day/week and all stock picks that I trade will be alerted and emailed to you.
Check out the Swing Service HERE
Follow me, Paul Singh AKA “TheMarketSpeculator” on Twitter or email me at SinghJD1@aol.com
Important Links
Link to YouTube Live-Stream on July 12th
[rf_contest contest=’10333′]
