Wanted to review my two posted trades from today and my thought process behind them..
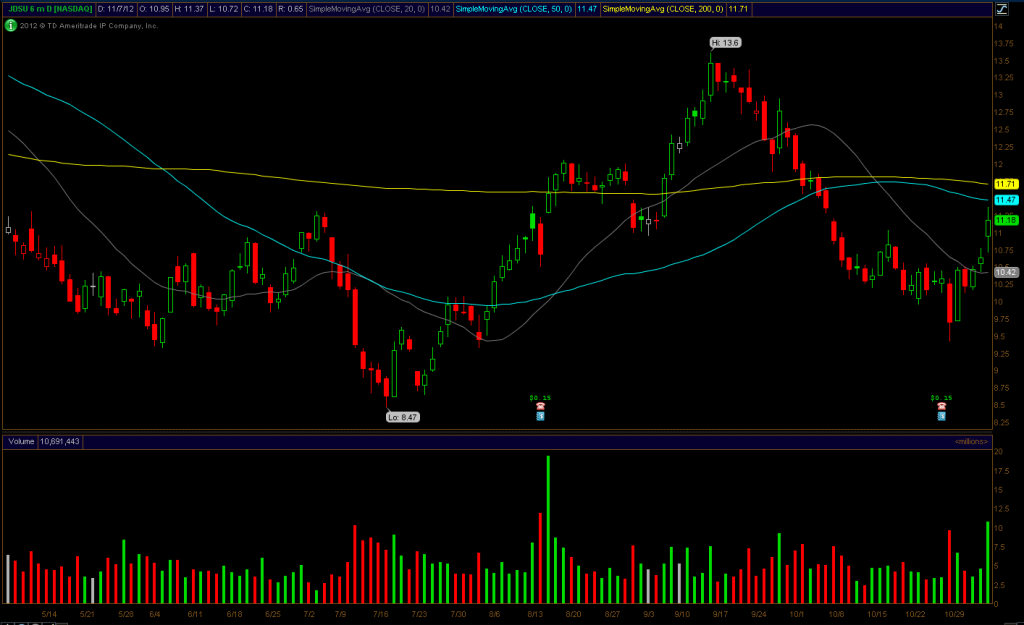
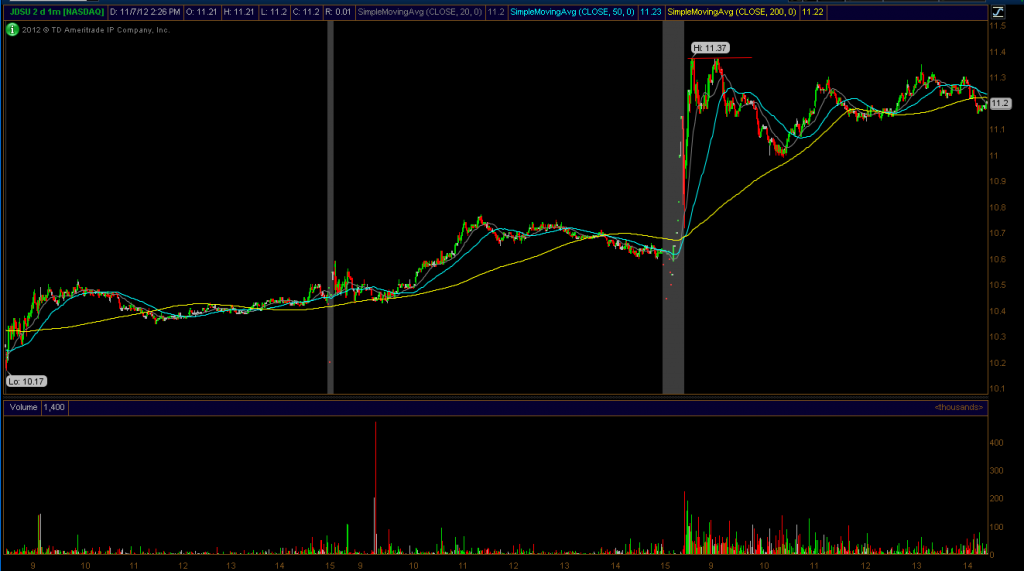
1. The first one was JDSU, I pretty much sold it right after I bought it and I wanted to explain the reasoning to you guys. I ran my morning scan for the top gainers and was looking at them on intraday charts. I saw JDSU and saw that it was forming a perfect intraday flag. My mistake came in that I decided to enter the intraday chart at 11.37 before taking a look at the daily chart. When I looked at the daily chart I saw that there was a 50day moving average right overhead at 11.47. So technically the stock didnt have alot of upside potential as there was only .10 cents until the major resistance came in. Therefore, the risk reward wasnt there. I sold almost immediatly for flat. Here is a look at the two charts both intraday and daily:
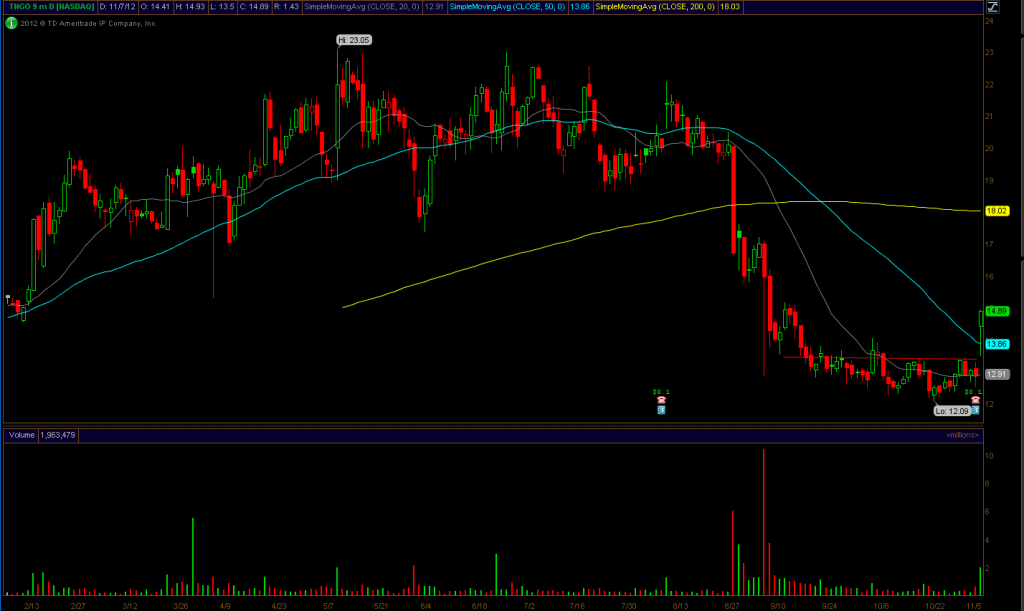
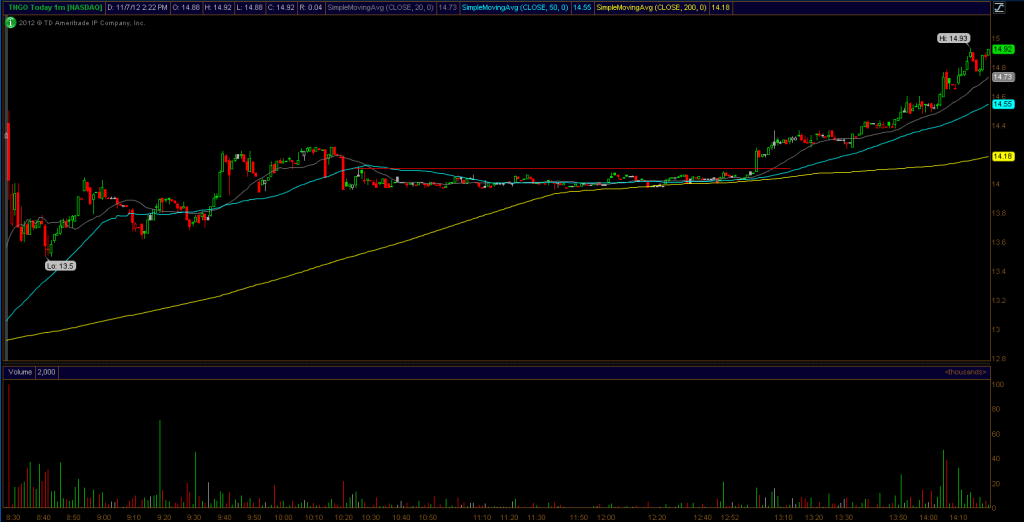
2. The second trade was an earnings intraday breakout chart. We love trading these and they are our specialty. TNGO was on the morning gappers list this morning and therefore was a potential earnings breakout play. The first thing we are looking for is some type of setup on these intraday charts. sometimes that setup can be a flag early in the morning and sometimes it can be a late day itnraday breakout. TNGO fit the late day intraday breakout criteria. We added the stock once the intraday base broke at 14.23.. it never broke that spot and was straight up from there. Earnings breakouts are very powerful in that they can make huge percentage moves. Once you get a stock breaking a major area of resistnace on the daily chart and its coupled with an earnings report.. thats when you get the fireworks. We sold off shares for a $208 gain.


