Quick Summary
SPY vs IWM. Small caps showing signs of improvement. Waiting for confirmation to short SPY again. Enter IWM long on pullback. A number of focus list stocks moved back to watchlist because no longer near entry levels. TSLA short setup. Focus list additions CAT (short), KORS (long), GOOGL (long). XHB (homebuilders) added to ETF List. Trader Education on what’s important at entry in trade journal.
The Market
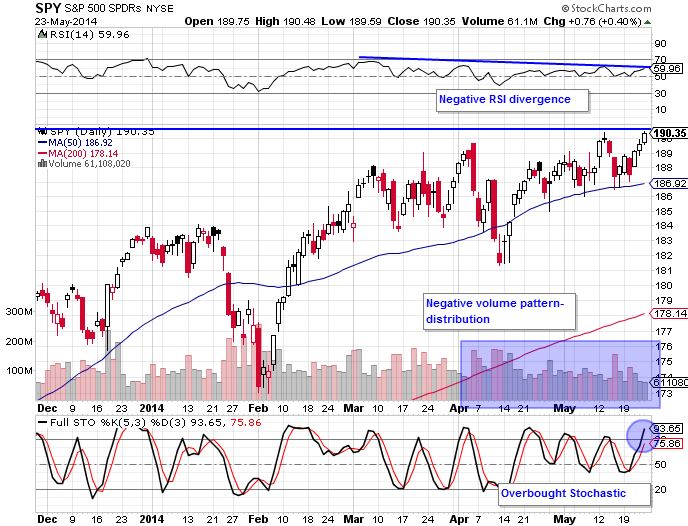
Key Pivot Levels: 190.42: new high resistance 186.74: 50 day moving average 181.31: recent low 181-184: plenty of buying in this range.
Under the Hood:
There are a number of reasons to be bearish about the new highs in SPY. We have talked about them since the inception of this report, and it’s been profitable trading SPY around these bearish signals. We have a negative RSI divergence, volume showing distribution, a price pattern showing hard drops that take a day or two followed by upmoves with small bars that take more days to recoup downside moves, small caps lagging SPY and now stochastics are overbought right at resistance.
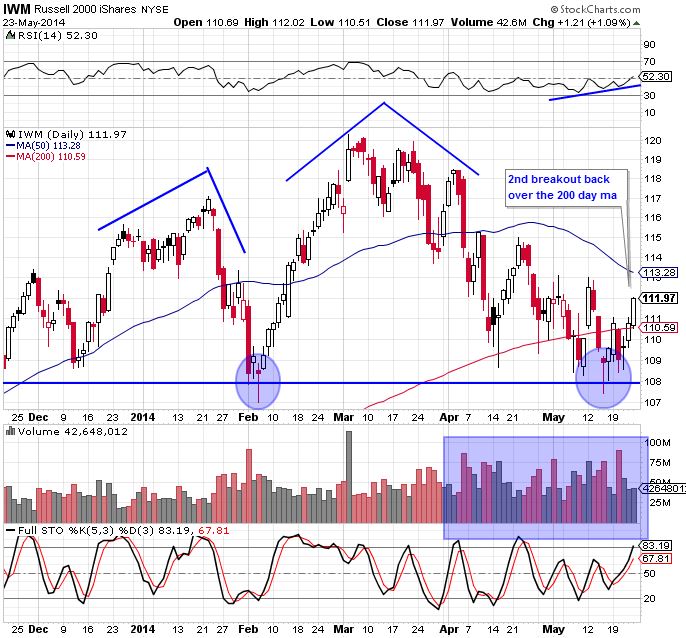
However, there is something very interesting taking place with small caps. I mentioned small caps lagging as a bearish indicator, and yes, it is. However, something interesting is taking place with the Russell 2000 (IWM). Unlike SPY, IWM has been printing very strong up bars over the past 11 trading days. Yes, down bars have been strong too, even stronger than SPY, and price still lags SPY during this time, but on Friday IWM doubled SPY’s gains. One day does not make a trend, but it’s worth watching.
Since this is the first time we have looked at IWM’s chart, let analyze further. A bearish head and shoulders pattern is in play. However, a second hammer candle has printed at the bottom of the pattern, and the top of the left shoulder is around $117. There is still plenty of room for IWM to move and still be within that pattern. Bounces can be played within this bearish pattern. RSI is also not showing a negative divergence. If fact, it is quite strong and higher than it was at the February hammer candle.
If IWM starts to catch up, that will be a positive for the market as bull markets tend to be lead by small caps.
Trading Game Plan:
So what do we do with this information? It is a signal to be more cautious shorting SPY here. I had thought about adding to my half position SPY short (half profits already taken), but will wait it out since I already have a short position and have locked in profits. I don’t plan to short SPY now until I see a *failed breakout*. What we would need to see is a breakout over $190.42, followed by a breakdown below that level. At that point, I would enter short again. This is the classic negative RSI divergence failed breakout setup. I tend to enter early in anticipation (as I did before) and allow myself to take small losses. This time I will wait for confirmation and trade the classic setup.
I will also look to go long IWM on a pullback. The 200 dma is at $110.59. My first target is under the 50dma at $113, so i’d like to get in around $111 so I can set my stop at $110 and still get 2:1 reward to risk.
Take focus list setups as they come. No directional bias.
The Focus List
Here we find actionable setups culled from “the watchlist” for the coming trading day.
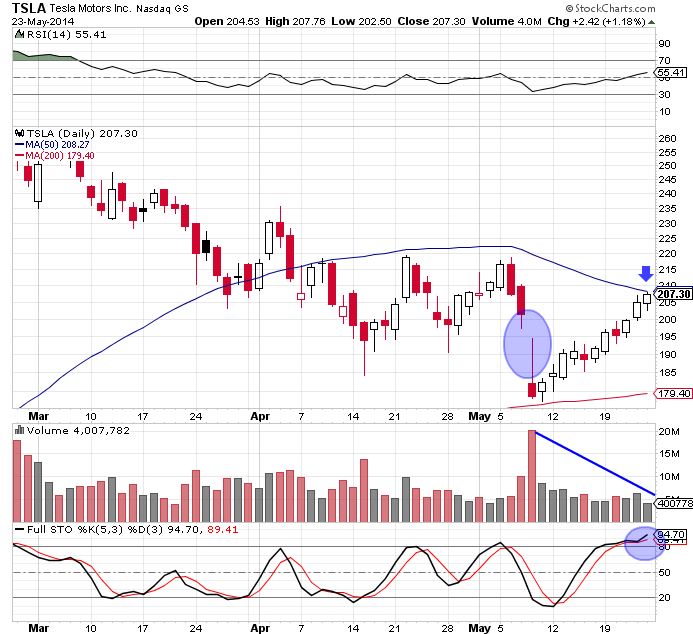
TSLA is still setting up as a breakdown-pullback short setup. It is just under the 50 dma and filled the breakdown gap. Stochastic is also overbought. I sent an alert on Friday that I entered this short position. The setup is still valid. Stop is in the $211-212 range and target is around $185.
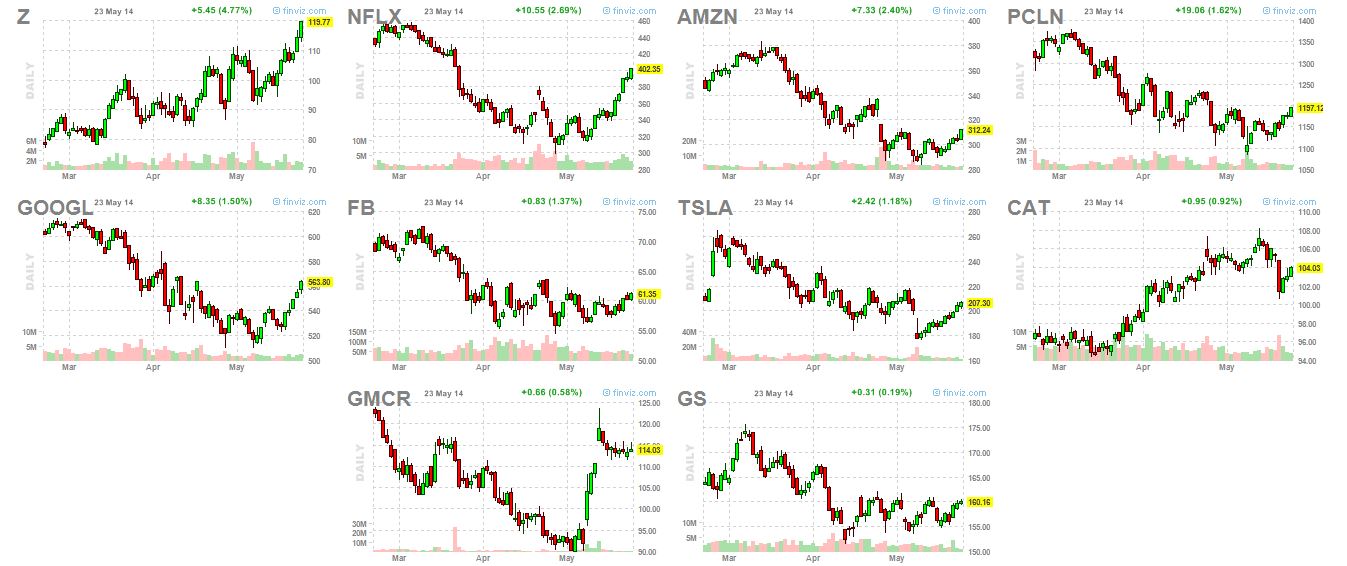
My stop was hit on the NFLX setup for a small loss. The stock is now back on the watchlist and I will wait for a pullback.
JAKK gained 2.37% on Friday and is nearing target levels for those who entered. It is now back on the watchlist and I will wait for another pullback.
UA is still up from where I entered and too far from entry to be on the focus list. It remains on the watchlist unless it pulls back or offers a different setup.
CDNS bounced hard and is too far from entry. It is back on the watchlist until it nears pullback entry.
CODE is still up slightly from entry and has a strong volume pattern. However it does not currently offer good risk reward so it is back on the watchlist.
Note: For those who entered these long positions, these setups are still valid. They are removed from the focus list because they do not provide good entry for those who have not entered.
Focus List Addition:
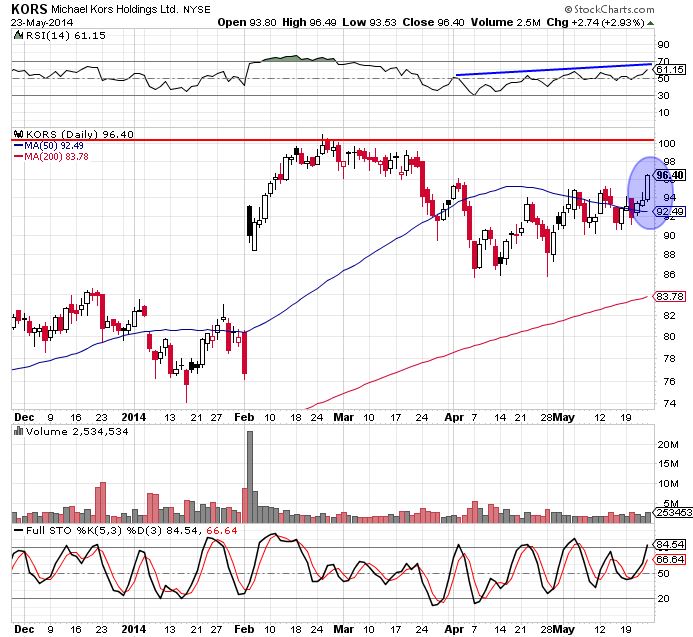
KORS stalled at round number $100 resistance and looks poised to make another attempt at it after clearly mounting the 50dma. I would like to enter on pullback to the $94-95 range with a stop around $91.50-92 and initial target at $100. RSI is strong, but the volume trend is average.
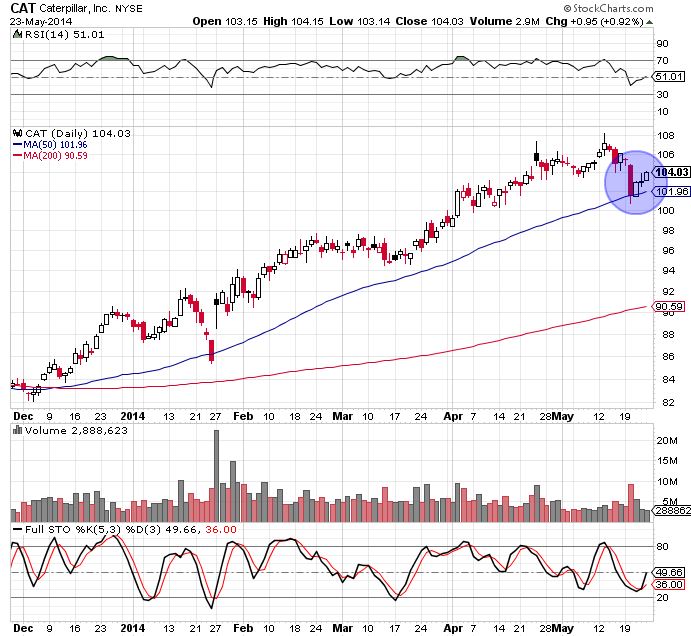
Market leader stock CAT is setting up as a breakdown-pullback short setup (post earnings). To state the obvious, this stock is going to either breakdown hard or resume the uptrend. The low risk setup here is to short near teh top of the breakdown bar. An intitial target at $102, with a stop at $106.50 provides less than 2:1 risk if entering around $104.50. However, the play here is for a meaningful trend breakdown which could take it down to the area of support in the $94-96 range or the 200 dma at $90.59.
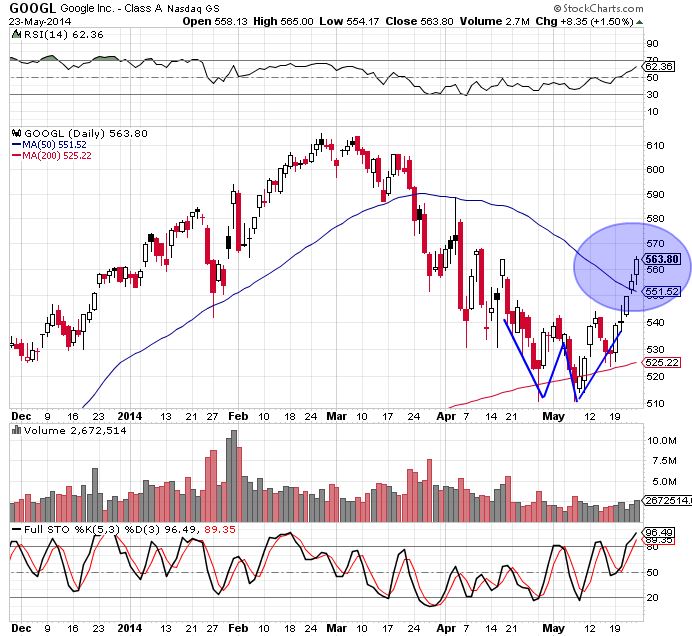
Another market leader stock GOOGL is following in NFLX’s footsteps with the exact same pattern. W bottom formation, remount of 5o dma and strong RSI. Before I was waiting for a deep pullback. This time I will enter on a shallow pullback. If I get in at the $555-560 range, with a stop under the ma at $545 , a target of $575 gives us adequate risk/reward. However, there is potential with old highs to go even higher–all the way to $610.
The Watchlist
Tomorrow I will spend most of my day weeding the watchlist and making some additions from new strong sectors such as homebuilders.
Market Leaders
These are stocks that I always watch, though they might not be in my tradeable watchlist, nor are they actually always leading the market (TSLA and NFLX certainly haven’t in recent months).
All market leaders, except TSLA and CAT, continue to show underlying strength. I’ve already commented on GOOGL and we have followed NFLX closely in the focus list. I would still like to find a good entry for GMCR, but the $110 gapfill is too far from current basing price level at $114.
Sector and International ETFs
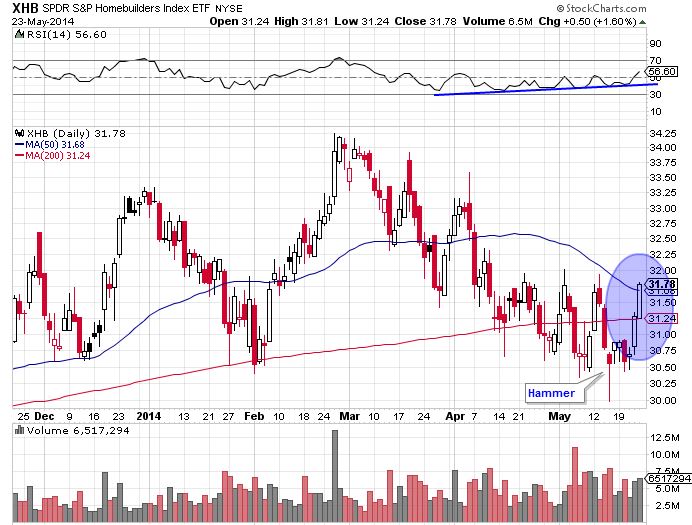
XHB (Homebuilders) is a new addition to the Sector Watchlist. A hammer candle at support lows recently printed and stock quickly remounted the 200 and 50 dma. RSI is very strong. Individual homebuilder stocks are very strong of late, such as DHI (which will be added to the watchlist).
Current Trades
Still holding a half position in SPY short after taking profits. Entered TSLA short. Stopped out of NFLX short position. Holding longs CODE, UA and GDP.
Trader Education
In yestereday’s blogpost 35 Important Tips to Make You a Better Trader, number 9 was to always journal why you entered a trade the same day you enter it. I always do this and don’t just simply record my entry price, stop and target. I always enter the setup (for instance, breakout-pullback), my risk ratio, support and resistance levels, what the market is doing and concerns I have for the trade. This information is invaluable when reviewing your trades.
New subscribers and trial members please leave me any feedback/comments in the comments, via email (singhjd1@aol.com) or twitter (twitter.com/PaulJSingh)