Quick Summary
SPY bouncing near resistance. Provides another short entry but not as strong as our original entry since it is another test. Watching old high (190+) and 50 dma (186.74) for potential breakout or breakdown. CDNS (long) and TSLA (short) added to focus list. UA, CODE and JAKK still near entry levels, NFLX is not. Market leaders PCLN, GS, FB, and GOOGL showing positive signs in bottom ranges and could follow NFLX lead. Oil sector–OIL/USO breaking out to new highs and could provide good pullback entry. Trader education talks about “converging support”.
The Market
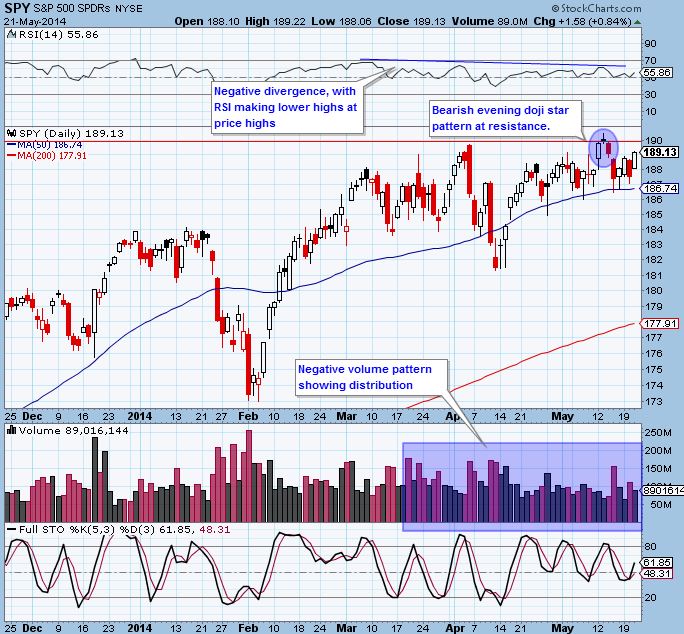
Key Pivot Levels: 190.42: new high resistance 186.74: 50 day moving average 181.31: recent low 181-184: plenty of buying in this range.
Under the Hood:
SPY closed up a little today, but overall nothing has changed. We still see a negative divergence in the RSI indicator, the volume pattern is still negative and bearish evening doji star pattern has not been breached. We are near resistance again. The coming week should give us more clarity and hopefully we either see a breakout of the $190 resistance area or a breakdown of the 50 dma.
Bearish Evening Doji Star pattern provide short opportunity at resistance levels.

T2108 (stocks trading above 40 day moving average) and A/D line are neutral.
Trading Game Plan:
Continue to hold remainder of SPY short positions (if you get stopped out, already locked in initial profit). The SPY bounce trade is nearing stop level if did not take profits (a separate trade of SPYon different time frame). If you missed out on the SPY short the first time, we are near an opportunity again. Note that the more times resistance is hit, the weaker it gets. This trade is not as strong as the first short. Continue to look for pullbacks to support in watchlist stocks. Right now I am content to use SPY or leverged ETFs as my short vehicle, since no major negative trends have emerged. If the 50 dma breaks, I will start adding short setups to my watchlist .
The Focus List
Here we find actionable setups culled from “the watchlist” for the coming trading day.
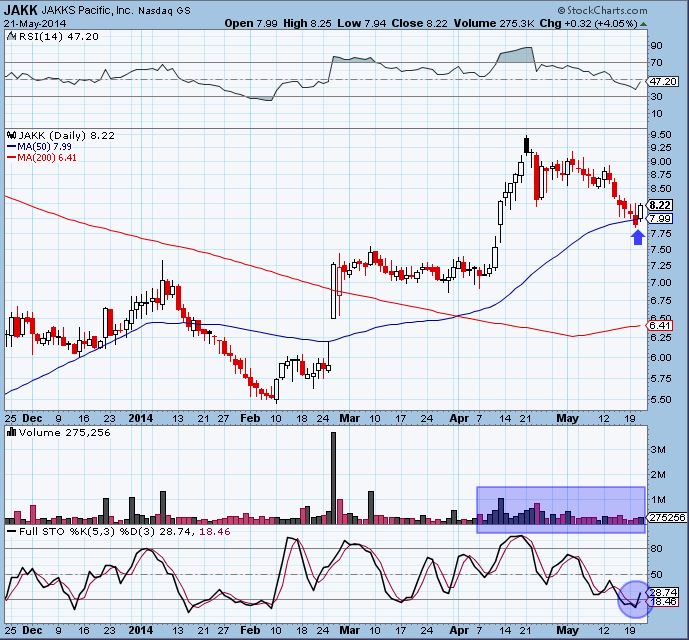
JAKK bounced strong today at support. Those still looking to enter can enter tomorrow on weakness.
This trade is a good example of why we set our stops below resistance support rather than right at resistance support. At resistance is where “fake outs” often occur, as was the case here with yesterday’s bar closing under the 50 dma before bouncing back up over today.
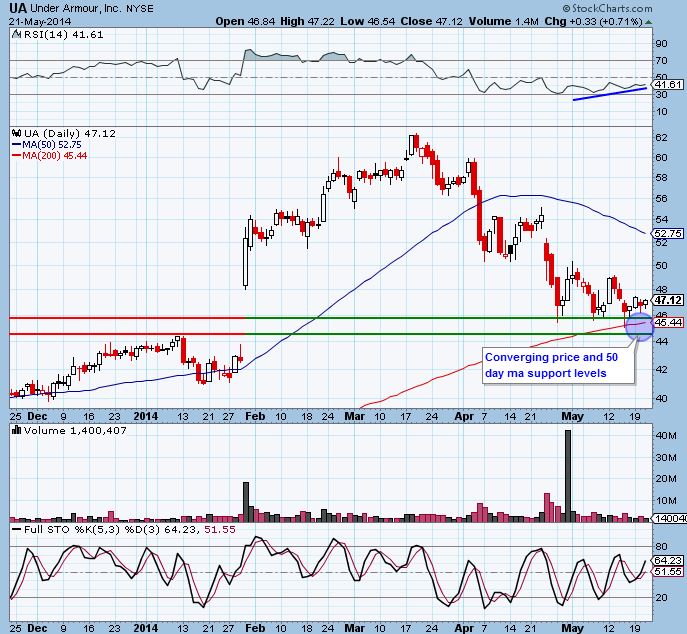
Little has changed with UA and it still provides an attractive entry providing a good risk ratio, and converging areas of support (price and moving average). Converging support lines strengthen support levels. Targets are around $50 and $53 (50 day moving average). Stop around $44.50
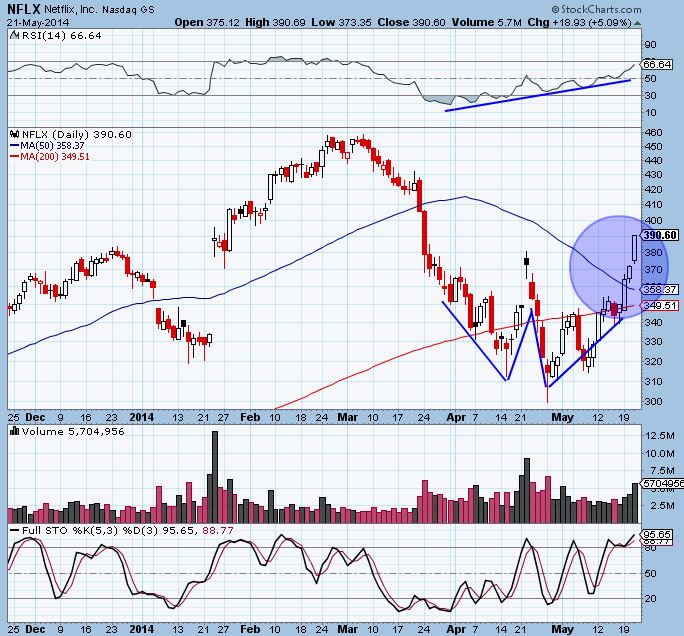
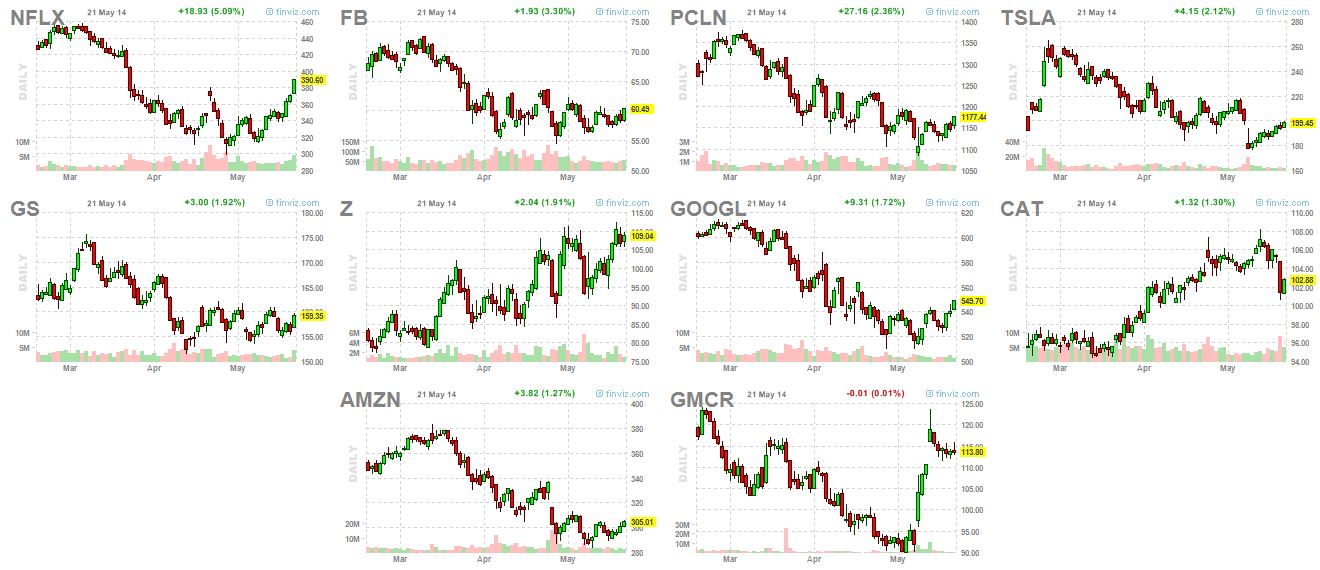
Color me frustrated with the big NFLX move. I have been stalking it since the “W” bottom formed, missed the trade when the hammer candle printed on the right side of the W in late April, and again missed the entry as price recently based near 200 day ma support. We were watching for a pullback to the 50 day ma, but today’s move blows that out of the water. I will wait for a good pullback entry, but for now this stock moves out of the focus list and remains in the “market leaders” watchlist category.
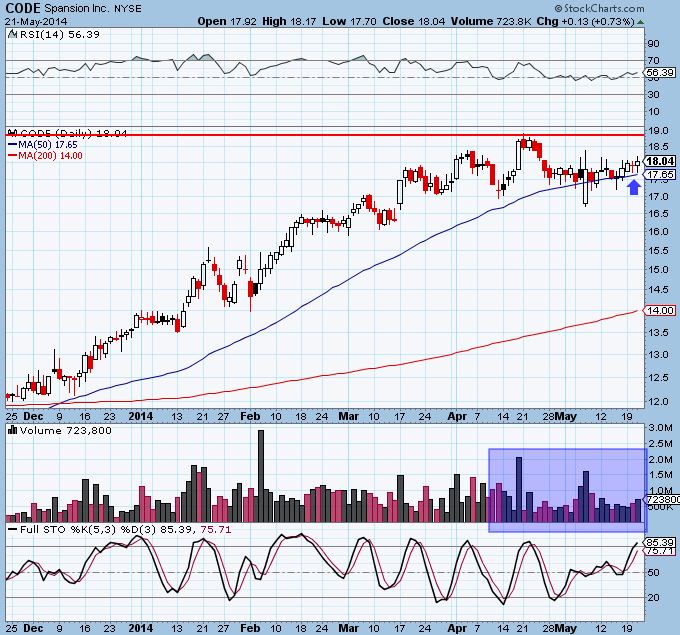
CODE continues to base just above support after pullback from multi-year highs.. The volume pattern is positive. An entry in the $17.60-17.70 range, with a target at $18.60 and stop at $17.35 provides 4:1 risk.
It is interesting that stochastics show an overbought stock, while my eyes tell me it is not, as it has pulled back enough from the recent highs (9 percent). I am not a slave to indicators and have decided to disregard stochastic here and go with my eyes.
New Focus List Additions:
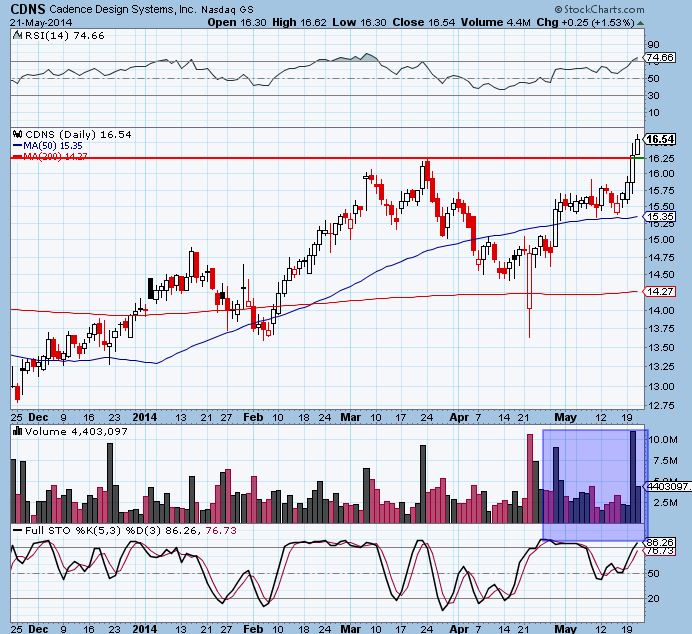
Yesterday CDNS was added to the Watchlist, and in one day it’s made it to the focus list. The stock broke out to new highs today. This is a breakout-pullback candidate. I will look to enter on pullback to the old high$16.25-16.30. If that doesn’t hold, another entry will be there in the $15.35-15.75 range 50 day ma and price support.
Notice that RSI and volume patterns are strong.
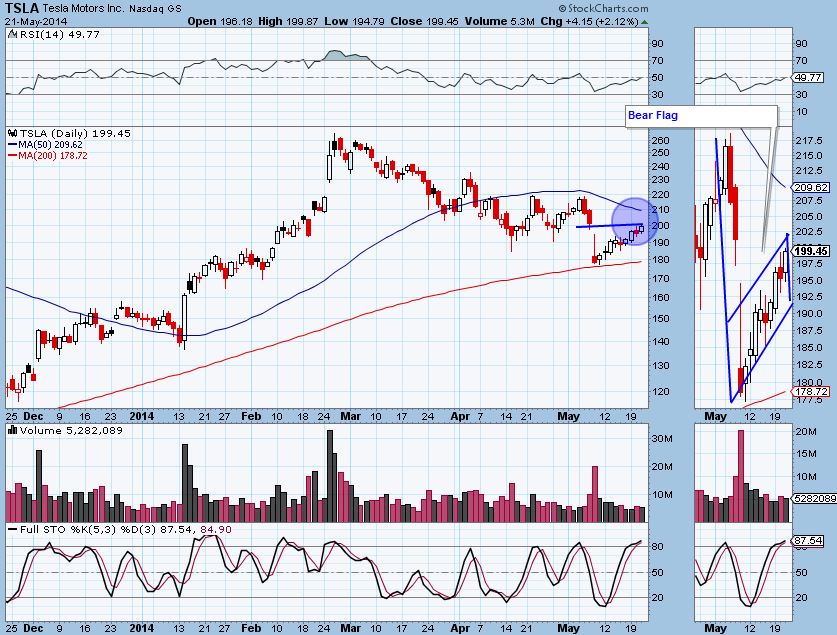
TSLA (short setup)
This is the first short setup we’ve had outside of the SPY short. We have a “bear flag” pattern (stock pulls up after a breakdown) that has pulled back up right into gap fill. Stochastics are extremely overbought. Normally I would enter here and see it as a perfect short setup. However, the 50 day moving average looms above. I am concerned that we could continue to pull up to that level. For now I am going to wait, but I can’t fault someone who enters here. Make sure to have a good risk ratio when entering.
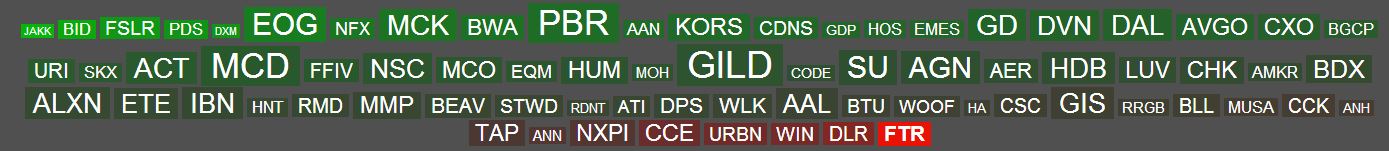
The Watchlist
The watchlist was strong today. Most stocks are still withing ranges and not breaking out or at pullback buy entries. CCE, DLR and FTR all made downside moves that could take them off the watchlist if there is not improvement in the coming days.
Market Leaders
These are stocks that I always watch, though they might not be in my tradeable watchlist, nor are they actually always leading the market (TSLA and NFLX certainly haven’t in recent months).
A number of these market leaders that have been beaten down are starting to show some positives within trading ranges near bottoms. PCLN, GS, FB, GOOGL and AMZN are all showing strong RSI and decent volume pattern within these ranges. Maybe they are ready to follow NFLX’s lead? I will be watching these closely. While not in the focus list, they are worth monitoring.
GMCR continues the pullback to gapfill. CAT followed yesterday’s breakdown with what could be the start of a pullback to the breakdown level. The TSLA flag short was discussed in the focus list.
Sector and International ETFs
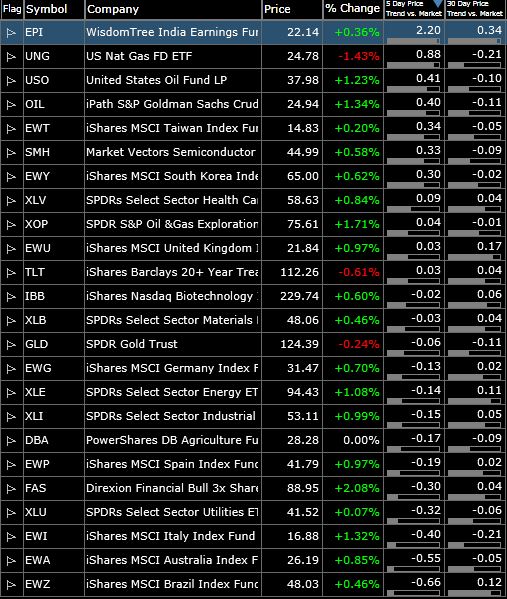
This list of “watchlist” ETFs is used a number of ways. Most are market leading ETFs that I use to find watchlist stocks using a “top down” approach. You’ll notice in my watchlist that a number of stocks come from healthcare. materials and energy, sectors that are represented here. I also trade ETFs that have good setups. Finally, following sector ETFs can give you an idea of where money is flowing and an overall gauge of the market. I carefully watch the 5 and 30 day price trends versus the market. This gives me an idea of where money was and is flowing.
Oil is breaking out, with USO and OIL both reaching new highs. These can be traded on pullback as breakout-pullback setups. Money continues to flow into India.
Current Trades
Still holding a half position in SPY short after taking profits. Holding CODE, UA and GDP.
Trader Education
Last night a subscriber asked me what I meant by “converging areas of support“.
It’s a very simple concept: two areas of support (or resistance for shorts) are better than one. There are four main supports I look at when we trade setups, price support, gap fill support (a variation of price support), “round number” support and moving average support. All of these supports are based on psychology, though I consider price and gap fill to be “real” and round number and moving average support to be “man made” supports. Price and gap fill are actual areas of buying and selling, supply and demand. People who lost out the first time are looking to buy at those levels, while at resistance traders who are holding onto losing positions are looking to unload and “break even”. These two supports are stronger than moving average and round number support, because it is based on “real” buying and selling. Round number support only exists because we place more value on a number like $100 than $99. There is no actual underlying price or volume levels that make $100 mean anything, and soon we realize this and support fails. Same goes for moving averages. Thus, when trading moving average and round numbers, I trade small unless I have price or gap fill support converging with the “man made” support.
The more of these supports/resistances I have converging at the same area, the stronger the area of s/r will hold.
If you are new, please read this lesson on the reward to risk ratio. It is important to my style of trading.
What is the holy grail of trading? It’s not a setup. It is the reward to risk ratio. The risk ratio is to trading what compound interest is to saving long term. To calculate your risk ratio going into a trade, you must know your entry level, target and stop level. Let’s use JAKK from the Focus List as our example. We came up with an entry at around $8.05, a stop at $7.75, a target at $9. We are risking .30 in order to gain 1.25. That gives us a 4:1 reward to risk ratio.
Why is this the holy grail? Think about what it does to the importance of your win rate. Let’s say you a $30,000 account and risk 1% of per trade ($300 loss). If you have a losing win rate of *only* 40 percent, over the course of 100 trades you will make $30,000, or double up on your account (40*1200)-(60*300). That’s with a 40 percent win rate!
It takes more than just giving yourself a good risk ratio. You must know where to place your stops and targets according to support and resistance, where to enter, how to manage the trade and position size in order to handle draw downs. However, this example shows the power of the reward to risk ratio.
New subscribers and trial members please leave me any feedback/comments in the comments, via email (singhjd1@aol.com) or twitter (twitter.com/PaulJSingh)